


Shifting into High Gear
The 2013 Special Finance Benchmarks are in, and all indications point toward a strong market for dealers and increased competition among finance companies.

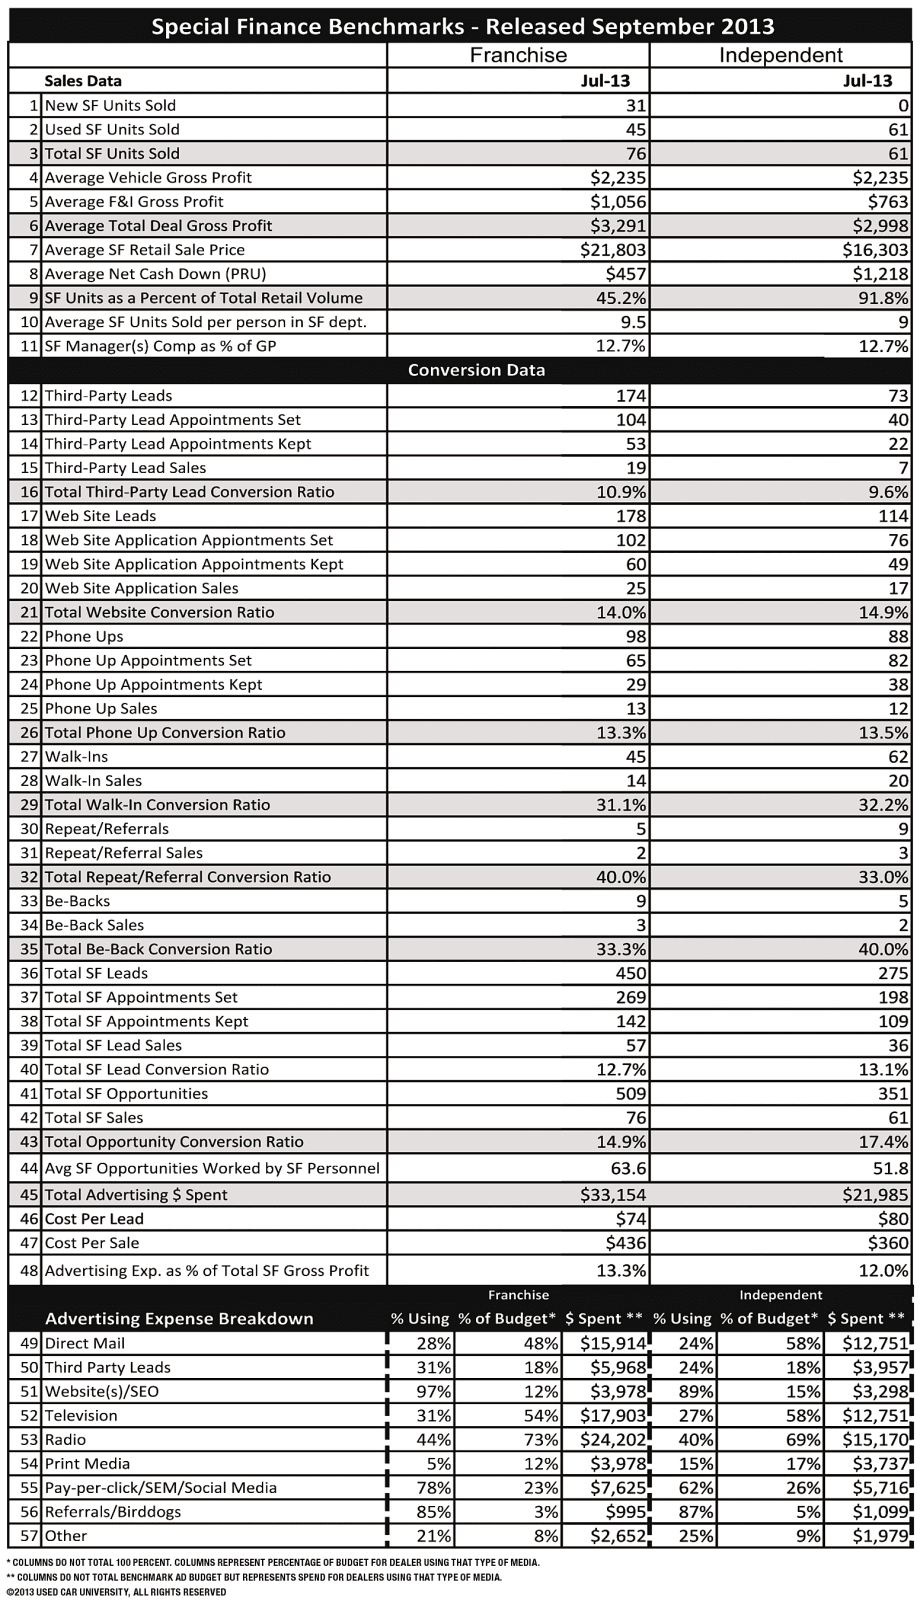
The 2013 Special Finance Benchmarks were announced at the Used Car University Subprime Conference, held last month in Las Vegas. To no one’s surprise, after analyzing tens of thousands of special finance (SF) transactions, the performance benchmarks increased in nearly every aspect of operation from 2012 to 2013. In some cases, the numbers came in at or above all-time highs. These upticks certainly demonstrate an aggressive and competitive battle for market share among auto finance companies.
The chart here supplies all the key metrics that comprise the Used Car University benchmarks, which are calculated at the 75th percentile levels. The following will delve into some of the most important metrics dealers typically look at daily.
Volume and Conversion Rates
We begin with deal volume and the general makeup of dealers’ SF businesses. While both franchised and independent dealers enjoyed a general uptick in volume, franchised dealers grew at a rate of slightly more than 10 percent — all based on new-vehicle sales. In 2012, new vehicles comprised 34.7 percent of a franchise dealer’s SF volume. In 2013, that ratio grew to a whopping 40.8 percent, which shows the strong influence of the captives’ subprime efforts. And their impact on the market is being felt all the way down to “Tier 4” SF customers.
And as unit volume increased, so did both the conversion ratio of showroom opportunities and deal gross profit. This year, franchised dealers converted 37.9 percent of the SF opportunities that made it into their showroom. They did slightly better than independents, which converted just less than 33 percent of their opportunities into sales.
Conversion of most lead types improved in 2013, especially third-party leads. Franchise dealers converted nearly 11 percent of their third-party leads, while independents converted nearly 10 percent — both significant improvements from 2012 and the past four years.
Internet leads also converted well. Independents delivered 14.9 percent of all SF leads they received from their websites, while franchised dealers delivered 14 percent of their leads, just a tick off from last year.
Phone conversion increased as well. As a group, franchised and independent dealers converted in the mid-13 percent range of all incoming SF phone calls.
One metric absent from this year’s benchmarks is the credit-hotline lead, where customers dial a toll-free number to apply for financing. Such leads have been a staple in the SF segment since the early 1990s. This year, however, marks the first time that an insufficient number of dealers reported credit-hotline usage, making the category’s results statistically irrelevant. Results from the few dealers who reported using credit-hotline leads were all over the map, making it impossible to set a benchmark.
Gross Profits
Gross profits on SF deals soared this year. Unlike the last two years, when there were significant differences in vehicle (front-end) gross profits between franchised and independent dealers, gross profits in 2013 came in close enough to set a single benchmark: $2,235 per SF vehicle sold. F&I (back-end) gross profits did continue to see a significant variance. The franchise benchmarks dipped ever so slightly to $1,056 per SF vehicle sold, while independents improved gross again to $763 — still far short of the franchised dealer mark.
Adding the front and back ends together, total deal benchmarks for 2013 come to $3,291 per SF vehicle sold by franchised dealers and $2,998 for independents. That’s a significant increase over 2012 and the past five years.
Marketing Spend
For the second consecutive year, SF advertising expenses still remain inefficient compared to past years. Franchised dealers actually reduced their ad cost per vehicle sold to $436, while independents crept up to $360. Additionally, ad expenses as a percent of gross profit still dropped for both sides due to the significant increase in deal gross profits.
Investment in advertising media varied significantly between franchised and independent dealers. Franchised dealers, who spend more money overall, tend to direct more of their ad budgets toward broadcast and digital than independents. They drive the customer to the phone or dealer website and then work leads through a call center or business development center (BDC). Only 11.5 percent of all the total opportunities received by franchised dealers are customers who walk into the dealership. As for independents, more than one in four customers walk into their stores before first contact.
Results also revealed that franchised and independent dealers amped up their broadcast media spends this year. Forty-four percent of franchised dealers spend money on radio advertising, and for those who do, that medium represents 73 percent of their entire SF advertising budget. TV is also in play. It’s used by nearly one in three franchised dealers, representing 54 percent of their ad budgets.
Whether franchise or independent, one thing is for sure: The numbers add up to increased success and penetration into the subprime credit market. While deal conversion and gross profits have not quite returned to 2007’s peak levels, they are not far off. In fact, it wouldn’t be surprising to see SF benchmarks reach all-time highs in 2014. As they say in the Midwest, “Make hay while the sun is shining!” Are you? For questions on these benchmarks or any other SF topic, please contact me anytime. Until next month, great selling!
More Dealer Ops

How to Avoid Phone Scams | Dealer Debrief 09/10/2026
Are you taking the necessary steps to protect your dealership and customer data from phone-based scams? This week's Dealer Debrief breaks down how!
Read More →
Dealer Debrief: August Auto Sales
Gas-powered engines still dominate the U.S. vehicle market, but hybrids are gaining ground as consumers look for ways to cut their gas costs.
Read More →
Dealership Profits Decline
While new and used retail sales stagnated, dealerships have been particularly supported by fixed operations and finance-and-insurance profits, according to a new report.
Read More →
Dealer Debrief: Defection Data & EV Updates
In this week's debrief, host Lauren Lawrence discusses how to use defection data to your advantage and the latest on EV sales and charging infrastructure.
Read More →
How Defection Data is Bridging the Dealership Conversion Gap
Lead volume is flat, cross-shopping is up and brand loyalty is in retreat. As confident sales teams keep losing buyers they thought they had, daily industry sales data is showing dealers exactly where their funnel is breaking and how to fix it without buying a single new lead.
Read More →
Dealer Debrief: Where are you losing customers?
In this week's debrief, host Lauren Lawrence discusses the hidden leaks in dealerships where you might be losing customers without even realizing it.
Read More →
Dealer Debrief: Improving Your Inventory Management
In this week's debrief, host Lauren Lawrence covers a new survey that shows what service technicians really want and two launches that could help improve your inventory and vehicle life cycle management.
Read More →
Ladies and Gentlemen, This Is a Dealership: Why the Fundamentals Still Decide Who Wins
A teaching moment by a legendary football coach happens to apply perfectly in the auto retail space. Learn what it is and how to use it to your store’s advantage.
Read More →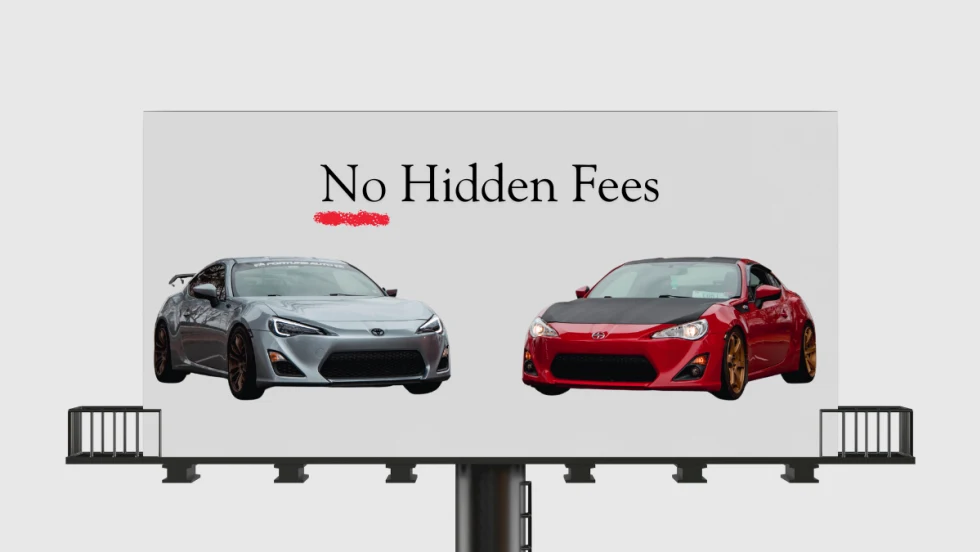
Dealer Ads and the FTC
The agency has made it clear in recent enforcement actions and warnings, in auto retail and other industries, that advertised prices must include all nonoptional costs to the consumer.
Read More →
Used Autos Supply Dwindles
The March shopping surge, despite high prices, cut into inventory by the most since the thick of the pandemic, Cox Automotive analysts calculated.
Read More →