



The Numbers Behind the Numbers
Data from dealers who are active in special finance yields guidance and several surprises.

I am often reminded of a famous quote popularized by Mark Twain: “There are three kinds of lies: lies, damned lies and statistics.” That may seem strange coming from a data-driven person such as myself. It is true that I always prefer to validate numbers and their significance before I offer any analysis.
At DealerStrong, we have been collecting transactional retail data from dealer clients all over the country for the past seven months. We finally have enough data to make some very good observations about some of the banks and finance companies that serve the special finance market. We have been validating the data to be sure the conclusions drawn from it are safe from the third type of lies as stated above.
The data has given us some tremendous insights into what is actually occurring at sales desks. Some were an affirmation of what I have believed for the past 24 years. Others came as a complete shock.
Before I offer conclusions, allow me to start with some disclaimers. First, these are my opinions derived from our proprietary data. The data, while significant, has some holes. Any omission of a finance company should not be interpreted as a negative recommendation or a reflection of their value to an SF department. There is a much smaller representation of Chrysler dealers (and therefore Chrysler Capital, i.e. Santander) than General Motors, Ford and import dealers. Additionally, trends change. Six months from now, all these figures and rankings could change. Finally, all the data represented are averages (50th percentile), not benchmarks (75th percentile).
Scores and Deals
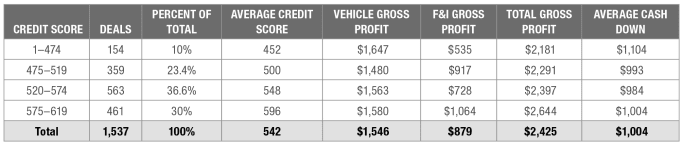
The chart below represents data collected from dealers — all active in special finance — from all across the U.S. during February and early March 2014. It represents a total of financed deals between a something-greater-than-a-zero score and 619, the area most representative of SF. Additionally, there are no zero-score sales. Many markets have good sources for those types of customers; just as many do not.
Gross profits are true, netting out any trade over-allowance. Cash down is true cash, not trade, received at time of sale. Gross profits reported by dealers for portfolio-based companies such as Credit Acceptance reflect monies received at the time of sale only — no “back-end” checks.
My first observation was that just 10 percent of the deals contracted had a score below 474, which is what I refer to as Tier 4. Not a surprise, as that is the most difficult credit tier. Those buyers seldom have a credit card, let alone the ability to finance anything. Most surprising was that the vehicle gross profits were (a) the highest among all tiers and (b) the total deal gross profits were not that dissimilar to the overall average. At $2,181 per deal, that represents 90% of the overall average at $2,425.
Perhaps the biggest surprise was that the cash down in Tier 4 was just $100 higher than the average — $1,104 compared to $1,004 — and that the down payments only varied by plus or minus 10% from the average across all tiers. That isn’t to say you shouldn’t try to get the customer to put more cash down. That will add to gross profit or help get them approved. The takeaway is that, on average, dealers and finance companies have found a way to make subprime deals work without large cash down payments.
Of the last 1,537 transactions reviewed, the average credit score (primary borrower and their best bureau score) came in at 542. No surprise there: That falls squarely into the 520–574 credit score range (Tier 2), which has for years represented the typical SF customer. So it should also come as no surprise that Tier 2 had more contracted deals than any other at 36.6% of the total pool. The big surprise is that it drew the lowest F&I gross profit among the four tiers.
Tiers, Banks and Finance Companies
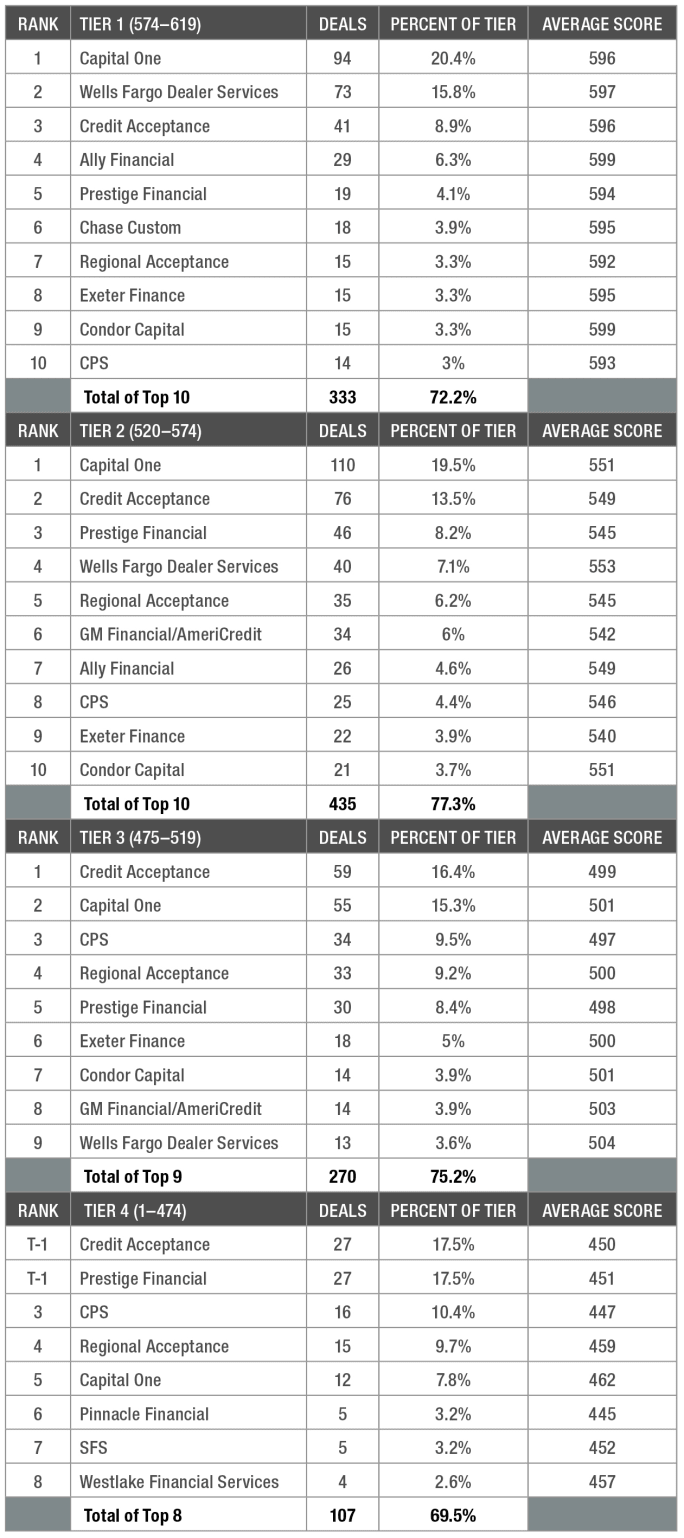
So now we move to the companies within the credit tiers. The charts on this page include all four SF credit tiers (nationally, as I define them) and list those companies that combined to make up the lion’s share of each of those tiers for our dealer clients. Again, I’m not trying to maintain one company is better than another, just illustrate where, among a group of active (and some elite) SF dealers, who is currently getting the most play.
Additionally, while not illustrated, there are some massive differences in average gross profits offered to dealers by various companies. As with the previous chart, each of the tiers offered some surprises.
The biggest surprise to me in Tier 1 was the presence of Credit Acceptance in the third position. That company bought nearly 9% of the total deals with an average credit score of 596. Most dealers think of Credit Acceptance as serving those who are toughest to finance. They certainly can do that as well — they lead Tiers 3 and 4 in volume — but this clearly shows they can play in Tier 1. Capital One Auto Finance’s appearance in the No. 1 spot for Tiers 1 and 2 should come as no surprise to anyone.
Tier 2 held a couple surprises as well. Credit Acceptance had the second highest volume, by a wide margin, on credit scores that were above average for the tier. Prestige Financial placed third in Tier 2 and ranked no lower than fifth in any tier; significantly, not a single Larry H. Miller dealership contributed to our data.
There certainly were some surprises in Tier 3. The first was that Capital One, certainly not known for being a tougher-credit finance company, placed second in volume. Capital One finished just a handful of deals behind Credit Acceptance and with an average credit score of 501. Another surprising aspect of Tier 3 was that nearly two-thirds of the business was shared among six finance companies.
Finally, Tier 4 had its own surprises. Prestige Financial tied Credit Acceptance for top volume within the credit tier. While not illustrated in the chart, their loan characteristics are significantly different, very likely due to the customers they work with. Credit Acceptance’s deals in this tier are characterized by significant cash down payments and hard-to-prove loan stips. Prestige does a significant business with open Chapter 7 bankruptcy customers, and that company’s average cash down was just $104.
What does all this tell you? Well, these numbers are averages, so you shouldn’t expect companies like Capital One, Prestige and Regional Acceptance to buy every 450 customer you send them. Note the distribution of buyers across all tiers. Prestige buys within a niche market. Some, like Regional and certainly Capital One, operate under tight parameters. This is a numbers game. At just 10 percent of the total SF deliveries, if you focus only on Tier 4 customers, you will likely have to submit twice as many applications, perhaps more, to come up with the same number of approvals. Deal structures likely are the determining factor. Having the proper inventory to build a good structure around will be what makes these deals.
At the same time, I see a number of people at finance desks fail to offer a customer to a particular bank or finance company because they don’t think it’s a fit. Pay attention to your relationships. Know who is concerned about look-to-book and book-to-approved ratios. Don’t be afraid to offer customers to companies that say, “Send us everything.” You just never know.

Finally, averages or not, these charts are a good yardstick. If you aren’t operating at benchmark, you know you can hit “average” with amazing accuracy. If you aren’t achieving the averages seen here, you can rest assured that you have one or a number of components in your operation that are limiting your performance.
I could fill this magazine with data analysis showing the vehicles and model years that work best for particular companies, which companies offer the overall highest gross profit, which require the most and the least amount of cash down, and so on. But I can’t give away all our data, and our publisher would run out of space if I did. I do hope this will either affirm that you are already doing well in SF. If not, at least you know these and other banks and finance companies are there to serve whatever credit situation each of your customers brings to your store. Please share your thoughts. Until next month, great selling!
Greg Goebel is the CEO of Used Car University and the industry’s leading special finance trainer since 1989. He is an 18-year former dealer principal and a highly sought-after speaker, author and consultant.
GGoebel@AutoDealerMonthly.com
More Dealer Ops

How to Avoid Phone Scams | Dealer Debrief 09/10/2026
Are you taking the necessary steps to protect your dealership and customer data from phone-based scams? This week's Dealer Debrief breaks down how!
Read More →
Dealer Debrief: August Auto Sales
Gas-powered engines still dominate the U.S. vehicle market, but hybrids are gaining ground as consumers look for ways to cut their gas costs.
Read More →
Dealership Profits Decline
While new and used retail sales stagnated, dealerships have been particularly supported by fixed operations and finance-and-insurance profits, according to a new report.
Read More →
Dealer Debrief: Defection Data & EV Updates
In this week's debrief, host Lauren Lawrence discusses how to use defection data to your advantage and the latest on EV sales and charging infrastructure.
Read More →
How Defection Data is Bridging the Dealership Conversion Gap
Lead volume is flat, cross-shopping is up and brand loyalty is in retreat. As confident sales teams keep losing buyers they thought they had, daily industry sales data is showing dealers exactly where their funnel is breaking and how to fix it without buying a single new lead.
Read More →
Dealer Debrief: Where are you losing customers?
In this week's debrief, host Lauren Lawrence discusses the hidden leaks in dealerships where you might be losing customers without even realizing it.
Read More →
Dealer Debrief: Improving Your Inventory Management
In this week's debrief, host Lauren Lawrence covers a new survey that shows what service technicians really want and two launches that could help improve your inventory and vehicle life cycle management.
Read More →
Ladies and Gentlemen, This Is a Dealership: Why the Fundamentals Still Decide Who Wins
A teaching moment by a legendary football coach happens to apply perfectly in the auto retail space. Learn what it is and how to use it to your store’s advantage.
Read More →
Dealer Ads and the FTC
The agency has made it clear in recent enforcement actions and warnings, in auto retail and other industries, that advertised prices must include all nonoptional costs to the consumer.
Read More →
Used Autos Supply Dwindles
The March shopping surge, despite high prices, cut into inventory by the most since the thick of the pandemic, Cox Automotive analysts calculated.
Read More →