


Wholesale Prices, Week Ending July 15
Sellers are beginning to adjust their floors, and the wholesale price trend reflects the adjustment; last week the market reported the largest single-week drop since mid-January. Leading up to the July Fourth holiday, the market had been trending downward, but sales rates were low as buyers exercised caution and sellers held tight on their floors. As we got into the first full week post-holiday, sellers were willing to negotiate. However, buyers this past week still were not jumping at the lower prices. Inventory levels on dealers’ lots are growing, and days-to-turn is also increasing, so they are only buying “good deals.”
This Week Last Week 2017-2019 Average (Same Week)
Car segments -0.77% -0.52% -0.39%
Truck & SUV segments -0.70% -0.45% -0.28%
Market -0.73% -0.47% -0.33%
Car Segments
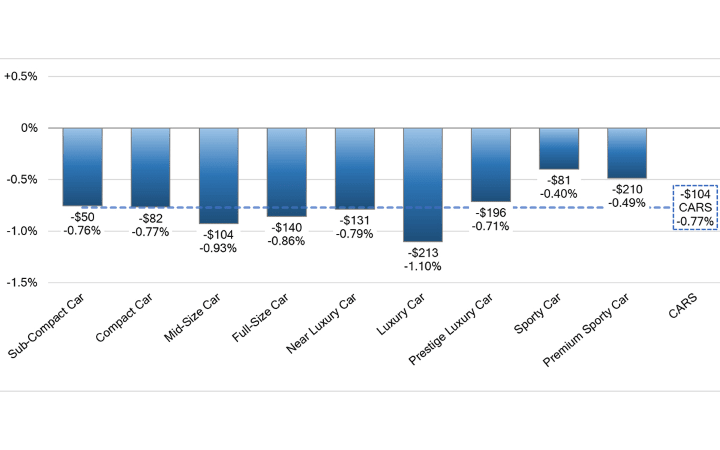
On a volume-weighted basis, the overall car segment decreased 0.77%. For reference, in the previous week, cars decreased by 0.52%.
The 0- to 2-year-old car segments were also down but only by -0.53%; 8- to 16-year-old cars declined 0.63%.
All nine car segments decreased last week.
The luxury car (-1.10%) segment was the only one with a decline greater than 1%, its largest single-week drop since the last week of 2022.
Sporty sar reported the smallest level of decline last week, down 0.40%, but it was still the largest depreciation for the segment since the week of New Year's.
Truck / SUV Segments
The volume-weighted overall truck segment decreased 0.70%, staying consistent with the prior week’s decrease of 0.45%.
The 0- to 2-year-old truck segments reported a smaller decline last week (-0.49%), as did the 8- to16-year-olds, which declined 0.52%.
All 13 truck segments reported a decrease last week.
Midsize and compact luxury crossovers reported the largest truck segment declines, down 1.12% and 1.34%, respectively.
Small pickups increased the rate of depreciation substantially, down 0.99% compared with -0.45% the week prior.
Weekly Wholesale Index
The graphic below looks at trends in wholesale prices of 2- to 6-year-old vehicles, indexed to the first week of the year. The index is computed keeping the average age of the mix constant to identify market movements.
Used Retail Prices
Used retail prices are more accessible than in years past due to the proliferation of no-haggle pricing. Transparent pricing upfront makes the car-buying process more enjoyable for customers and allows Black Book to accurately measure retail market trends.At the onset of the pandemic, in CY2020, used retail prices increased slightly, following typical seasonal patterns, then began dropping in April, finally hitting a low point in the late spring months. By late summer of CY2020, used retail prices increased as supply of new-vehicle inventory started to become scarce, but retail demand slowed at the end of CY2020, resulting in declining retail asking prices for the last several weeks of the year. When CY2021 kicked off, demand rebounded while retail prices lagged slightly behind wholesale prices; March 2021 started the dramatic increases in used retail prices, fueled by stimulus payments, tax season and shortages of new inventory. During the third quarter, retail prices continued to rise at a slower rate but soon picked up once again to start the fourth quarter, when they steadily increased week after week. As CY2021 came to an end, the retail listing price index closed 36% above where the year began. The index then remained relatively stagnant through most of CY2022. In the fourth quarter of 2022, the Retail Listings Price Index started to decline, but declines weren't as steep as the wholesale price index.
This analysis is based on approximately two million vehicles listed for sale on U.S. dealer lots. The graphic below looks at 2- to 6-year-old vehicles. The index is computed keeping the average age of the mix constant to identify market movements.
Inventory
Used Retail
The Used Retail Active Listing Volume Index reverted back to one at the start of the year and currently sits at 1.01 points.
The used retail days-to-turn estimate is currently around 53.
Wholesale
Halfway through July, prices continue to drop in all segments. Sellers are starting to loosen their floors on all segments. As we saw last week, buyers were more willing to purchase but still exercised caution as they looked for “good deals.” With lower floors, the sales rate finally showed a small improvement.
As always, the Black Book team of Analysts will keep their eyes on the market, watching for developing trends and insights.
The estimated average weekly sales tate improved slightly to 47% last week.