
Black Book: Weekly Market Report
It was another stable week in the lanes last week. Inventory is still available and consistent, but there has been a noticeable increase of IF sales and no sales.

It was another stable week in the lanes last week. Inventory is still available and consistent, but there has been a noticeable increase of IF sales and no sales.
Black Book Market Insights: 11/1/2022
Wholesale Prices, Week Ending October 29th
The fourth quarter is when the market traditionally experiences the largest declines of the year and this year is following the same path. The month of October is finishing up with some large declines as retail demand remains soft and many sellers continue to hold firm on their floors, while others accept the changes in the market and allow their vehicles to sell at the current market rate.
This Week Last Week 2017-2019 Average (Same Week)
Car segments -1.47% -0.89% -0.57%
Truck & SUV segments -1.05% -0.70% -0.51%
Market -1.19% -0.76% -0.54%
Car Segments
On a volume-weighted basis, the overall Car segment decreased -1.47%. For reference, the previous week, cars decreased by -0.89%.
All nine Car segments decreased last week.
Five of the nine Car segments reported a decline greater than 1%; Sub-Compact led the declines at -.3.68%, followed by Mid-Size (-2.55%), Full-Size (-1.72%), Prestige Luxury (-1.54%), and Sporty (-1.35%).
Premium Sporty Car reported the smallest decline of -0.43%, but still larger than the prior week’s -0.37% drop.
Truck / SUV Segments
The volume-weighted, overall Truck segment decreased -1.05%, compared with the prior week’s decline of -0.70%.
All thirteen Truck segments reported declines last week.
Five of the thirteen Truck segments reported a decline greater than 1%; Sub-Compact Crossover (-2.46%) and Minivan (-2.50%) had the largest declines, followed by Mid-Size (-1.43%), Sub-Compact Luxury (-1.35%), and Compact Crossover (-1.33%).
Full-Size Pickup slowed the rate of declines, reporting a drop of -0.31%, compared to -0.51% the week prior.
Weekly Wholesale Index
Calendar year 2020 and 2021 ended with used wholesale prices at elevated levels. With economic patterns (including the automotive market) driven by the pandemic, normal seasonal patterns (e.g., 2019 calendar year) in the wholesale market were not observed for most of the last two years. We saw a similar picture in 2009, at the end of the Great Recession. Calendar year 2021 did not have typical seasonality patterns as the market had rapid increases in wholesale values for the majority of the year. The Wholesale Weekly Price Index reached the highest point of the year at the end of December 2021, reporting over 1.51 points.
The graph below looks at trends in wholesale prices of 2-6-year-old vehicles, indexed to the first week of the year. The index is computed keeping the average age of the mix constant to identify market movements.
Retail (Used and New) Insights
Hyundai Motor broke ground last week on a $5.54 billion EV manufacturing plant in Georgia; the new facility is expected to produce EV models and batteries for Hyundai, Genesis, and Kia brands.
Toyota unveiled a Corolla-Sized EV Sedan – the bZ3, which is expected to have 372 miles of range; at this time, the bZ3 will only be available in China.
Volvo has teased the EX90 dash design; the electric SUV is expected to be unveiled soon, and Volvo has been preparing for their Level 3 driver-assist system rollout.
Tesla announced that they are working again on a new platform for a smaller EV that some have named the Model 2; there is no clear timeline, but the vehicle is expected to be half the cost of the Model 3.
Ford will stop producing the Ford Fiesta altogether by next summer, a year earlier than originally anticipated.
As Mazda prepares to rollout the CX-70 and CX-90 in the U.S., there are also plans to unveil an updated EV strategy later this month.
Volkswagen announced that their R sub-brand will be fully electric by 2030, which is much sooner than the timeline for the full Volkswagen lineup to go green.
Used Retail Prices
Used Retail Prices are more accessible than in years past, due to the proliferation of ‘no-haggle pricing’ for used-vehicle retailing. Transparent pricing upfront makes the car buying process more enjoyable for customers and allows Black Book to accurately measure retail market trends.
At the on-set of the pandemic, in CY2020, used retail prices increased slightly, following typical seasonal patterns, and then began dropping in April, finally hitting a low point in the late spring months. By late summer of CY2020, Used Retail Prices increased as supply of new vehicle inventory started to become scarce, but retail demand slowed down at the end of CY2020, resulting in declining retail asking prices for the last several weeks of the year. When CY2021 kicked off, demand rebounded while retail prices lagged slightly behind wholesale prices; March of 2021 started the dramatic increases in Used Retail Prices, fueled by stimulus payments, tax season, and shortages of new inventory. During the third quarter, retail prices continued to rise at a slower rate but soon picked up the pace once again to start the fourth quarter. In Q4, prices on retail listings steadily increased week after week. As CY2021 came to an end, the retail listing price index closed 36% above where the year began.
Now, in the fourth quarter of 2022, the Retail Listings Price Index has started to decline, but not as steep as the wholesale price index.
This analysis is based on approximately two million vehicles listed for sale on U.S. dealer lots. The graph below looks at 2-6-year-old vehicles. The Index is computed keeping the average age of the mix constant to identify market movements.
Inventory
Used Retail
Used retail active listing volume remained around 1.13.
The Used Retail Days-to-Turn estimate is around 43 days.
Wholesale
It was another stable week in the lanes last week. Inventory is still available and consistent, but there has been a noticeable increase of IF sales and no sales. This could mean that there is room for negotiation between sellers and buyers and hopefully, they will reach some middle ground soon. Buyer count remains stable, which could potentially mean that buyers are patiently waiting for sellers to soften their floors. There are still minimal signs of flood vehicles coming through, but announcements of flood vehicles from the recent hurricane are expected. In addition, with vehicle delinquencies increasing, an uptick in repossessions may make their way to auction lanes soon. Some model year 2023 vehicles are popping up in the lanes, which is no surprise as more model year 2024 launches and vehicle announcements are coming out. Newer used vehicles (model year 2018 to model year 2020) values seem to be slightly increasing, although overall, wholesale values are continuing to decline.
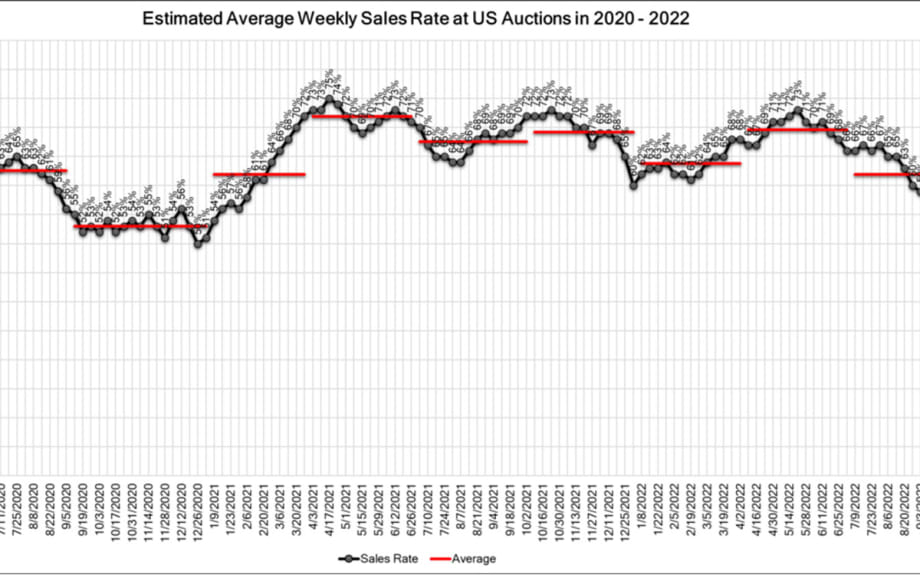
The Estimated Average Weekly Sales Rate remained at 54% last week.
Originally posted on F&I and Showroom
More Dealer Ops

Ladies and Gentlemen, This Is a Dealership: Why the Fundamentals Still Decide Who Wins
A teaching moment by a legendary football coach happens to apply perfectly in the auto retail space. Learn what it is and how to use it to your store’s advantage.
Read More →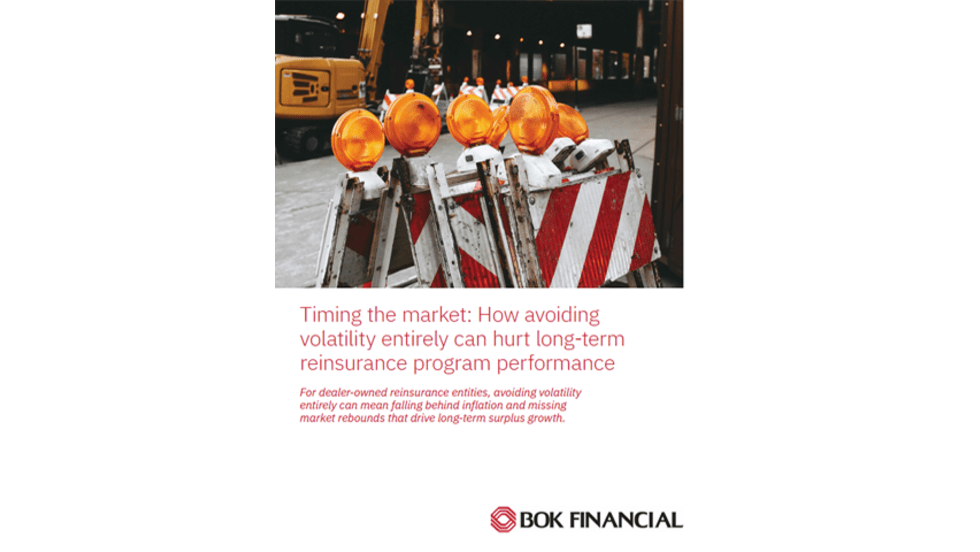
Timing the Market Can Hurt Long-Term Program Performance
For dealer-owned reinsurance entities, avoiding volatility entirely can mean falling behind inflation and missing market rebounds that drive long term surplus growth. Missing just a handful of strong market days can materially impact cumulative returns—an important reminder for long horizon trust and investment strategies.
Read More →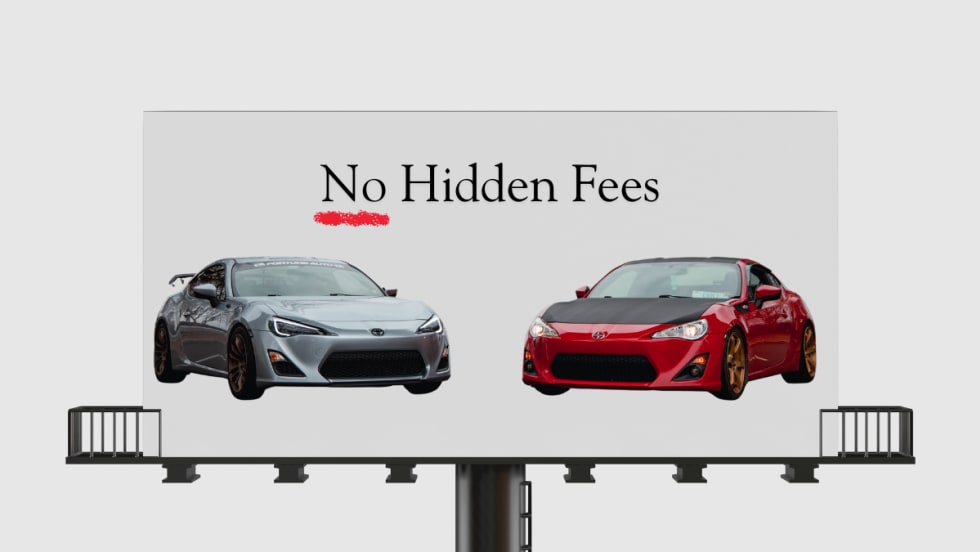
Dealer Ads and the FTC
The agency has made it clear in recent enforcement actions and warnings, in auto retail and other industries, that advertised prices must include all nonoptional costs to the consumer.
Read More →
Used Autos Supply Dwindles
The March shopping surge, despite high prices, cut into inventory by the most since the thick of the pandemic, Cox Automotive analysts calculated.
Read More →
Managing Risk Effectively Through Changing Times
The variables influencing risk pricing have changed significantly over the past five years. Being proactive and responsive to emerging trends is not optional but essential.
Read More →
Survey Reveals What Won't Fix What's Breaking Car Sales
AutoPayPlus says extra-long auto loans are trapping consumers and threatening the dealer trade-in cycle, and that the industry is leveraging the wrong tools to combat high MSRPs.
Read More →
IA American Appoints Two Execs
Senior vice presidents of the company's agent and dealer channels chosen to support general agents and help auto dealers with sales and performance.
Read More →
Cox Automotive Acquires Inspection Firm
Full ownership of Alliance Inspection Management, or AiM, meant to unlock growth for Manheim inspection capabilities
Read More →
Assurant Expands Partnership With Holman
Extended collaboration delivers training, products and performance development to 30 newly acquired Holman dealerships
Read More →
Franchises, Throughput Down in First Half
A handful of states see franchise growth through June, while EV sales per store boost overall business in U.S.
Read More →