
Service Activity Spikes in May
Analysis of Xtime data showed increases in Repair Order Volume Index and the Repair Order Revenue Index.

Data shows a year-over-year increase in the Repair Order Volume Index and the Repair Order Revenue Index.
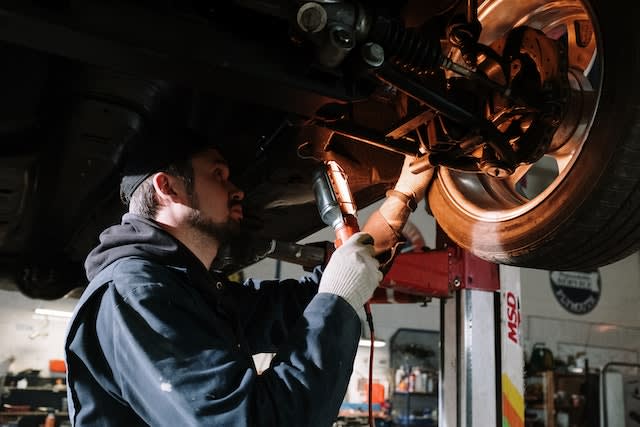
Pexels
Service activity increased notably at franchised dealerships in the U.S. in May compared to the previous month, according to analysis by Cox Automotive of Xtime metrics.
The analysis also showed service revenue decreased slightly from record highs in March and April and a year-over-year increase in both the Repair Order Volume Index and the Repair Order Revenue Index.
The May Repair Order Volume Index surged to 88.2, a 7.0% increase from April's upwardly revised figure, and a 1.8% increase from May 2022, which is the first year-over-year boost in service ticket volume since January.
The Repair Order Revenue Index for May came in at 132.4, down 1.3% from an upwardly revised April figure, and up 4.5% year over year. The average revenue per repair order declined by $8 from April's revised record high.
Xtime volume and revenue metrics present the average performance of the service department at franchised dealerships in the U.S. over time, with January 2019 as the point of comparison. Xtime, a Cox Automotive brand, provides software to help auto dealers schedule and manage over 10 million service appointments every month.
Cox Automotive Industry Insights and the Xtime data team analyze and compile this data into the Repair Order Volume Index and Repair Order Revenue Index around the 20th of each month.
More Dealer Ops

Ladies and Gentlemen, This Is a Dealership: Why the Fundamentals Still Decide Who Wins
A teaching moment by a legendary football coach happens to apply perfectly in the auto retail space. Learn what it is and how to use it to your store’s advantage.
Read More →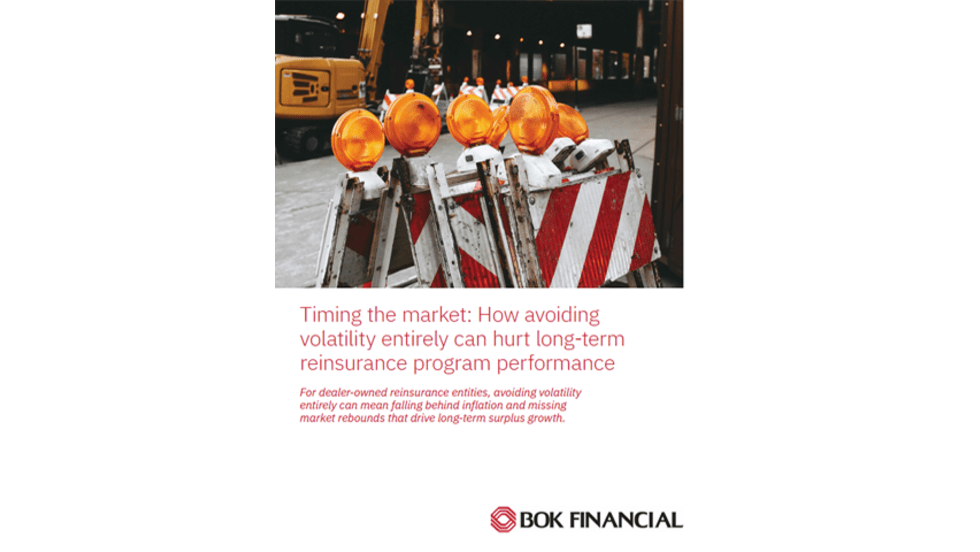
Timing the Market Can Hurt Long-Term Program Performance
For dealer-owned reinsurance entities, avoiding volatility entirely can mean falling behind inflation and missing market rebounds that drive long term surplus growth. Missing just a handful of strong market days can materially impact cumulative returns—an important reminder for long horizon trust and investment strategies.
Read More →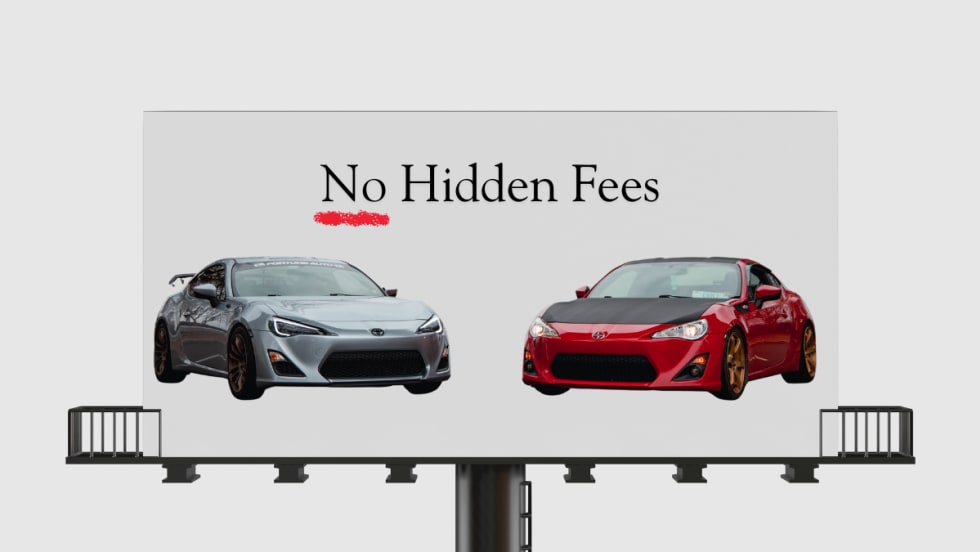
Dealer Ads and the FTC
The agency has made it clear in recent enforcement actions and warnings, in auto retail and other industries, that advertised prices must include all nonoptional costs to the consumer.
Read More →
Used Autos Supply Dwindles
The March shopping surge, despite high prices, cut into inventory by the most since the thick of the pandemic, Cox Automotive analysts calculated.
Read More →
Managing Risk Effectively Through Changing Times
The variables influencing risk pricing have changed significantly over the past five years. Being proactive and responsive to emerging trends is not optional but essential.
Read More →
Survey Reveals What Won't Fix What's Breaking Car Sales
AutoPayPlus says extra-long auto loans are trapping consumers and threatening the dealer trade-in cycle, and that the industry is leveraging the wrong tools to combat high MSRPs.
Read More →
IA American Appoints Two Execs
Senior vice presidents of the company's agent and dealer channels chosen to support general agents and help auto dealers with sales and performance.
Read More →
Cox Automotive Acquires Inspection Firm
Full ownership of Alliance Inspection Management, or AiM, meant to unlock growth for Manheim inspection capabilities
Read More →
Assurant Expands Partnership With Holman
Extended collaboration delivers training, products and performance development to 30 newly acquired Holman dealerships
Read More →
Franchises, Throughput Down in First Half
A handful of states see franchise growth through June, while EV sales per store boost overall business in U.S.
Read More →