

Don’t Fire Your Best F&I Manager
Looking to thin your F&I herd? Advanced analytics prove there are better ways to judge performance than PVR alone.
Your people make or break your business. Your weakest F&I manager costs you lost profit every month. They also cost you future streams of opportunity. It is inevitable that someone will be your worst performer. The only question is how to be sure if letting that person go will improve the department’s overall performance.
Let’s take a look at an example that proves your data can lead you to the wrong answer.
We Need to Talk
Let’s say you have five F&I managers. Bill appears to be the worst performer with an F&I profit per vehicle retailed (PVR) average of $657, compared to a department average of $856 average — a difference of $199. He worked 568 deals. You calculate that, if you fire Bill and give his work to the others, your profit will increase by $199 times 568 or $113,000.
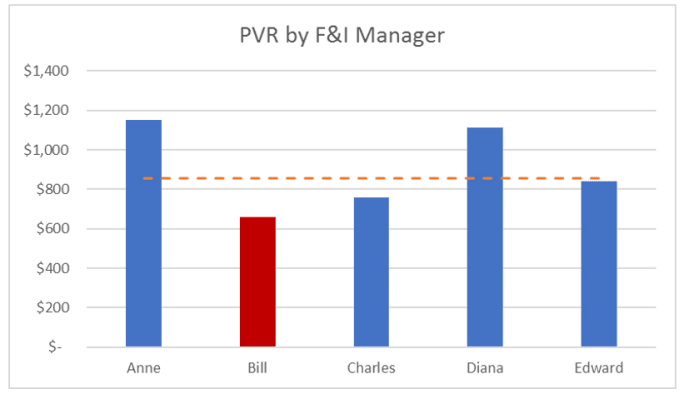
Time for Bill to go! … Or is it?
Let’s do a bit more analysis. When we look at your team’s PVR on a model-by-model basis, a different answer emerges. It turns out that Bill is the best performer for three vehicles!

Why is it, then, that Bill has the worst PVR? The mix of deals that he does skews heavily toward ones in which he does best: Accord and Civic. These two happen to be the low-margin and high-volume vehicles for the dealership. The model mix drags down his PVR score.

Let’s sharpen our pencil and figure out what would happen if we moved Bill’s deals to the others, but this time we account for the PVR by model. We find that PVR reduces for four models and improves for three.
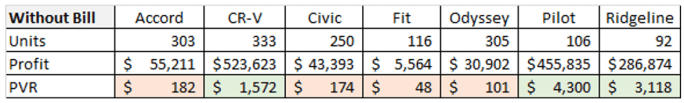
The detailed analysis shows that the total profit would fall by $262,000. The estimated benefit of removing Bill turns out, on further analysis, to be a big loss. This is why you must always dig deeper.
It is difficult to see the combined impact of PVR mix and volume mix by model. F&I manager performance becomes a four-dimensional matrix, with manager, model, PVR and volume as the dimensions. How can we quickly see these four dimensions all together in a two-dimensional chart?
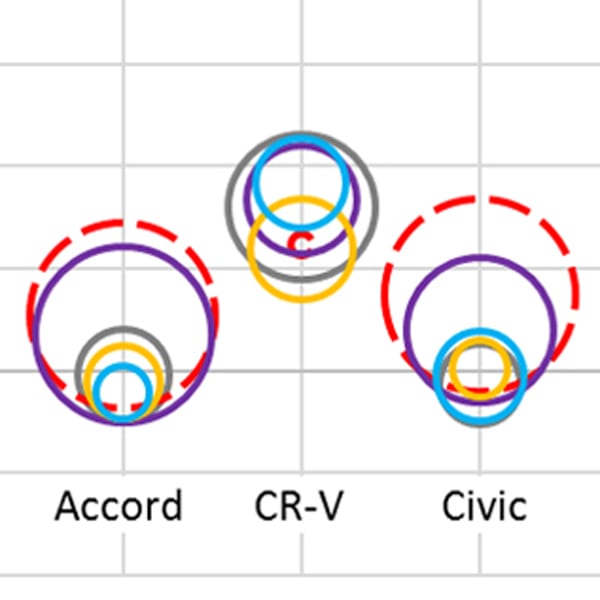
Hoop charts to the rescue! Instead of using a point, we can use a hoop whose size depicts another dimension of the data. The F&I manager becomes a color code. Now you can see the four-dimensional information contained in these tables in one view.
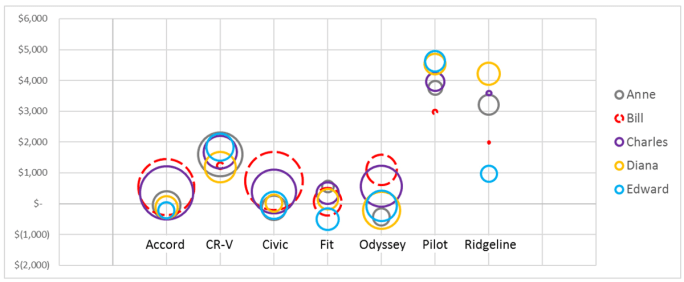
In the hoop chart, you can see that Bill rises to the top of the PVR chart for Accord, Civic and Odyssey. The size tells you that, if you burst those bubbles by removing Bill, the gross on those models will fall substantially as those hoops drop down to the average PVR for the remaining managers. The hoop for the Fit won’t move much. The tiny hoops for the CR-V, Pilot and Ridgeline will be outweighed by the big ones. The chart tells you to keep Bill.
Keep It Complicated
Removing or retraining poor performers is a big lever in the hands of a dealer or F&I director. Applying that lever correctly requires you to analyze performance data with great care. Business performance is multidimensional. Simplistic tools are not useful for critical decisions that impact employee morale, performance and loyalty.
I tailored this data to cast Bill in a bad light using the most common performance metric, and then to recast him as a good performer based on the detail. In real life, you must look at the key metrics and into the details before you make decisions. It takes time and effort to do calculations involving different tables, and it becomes difficult to do on an ongoing basis under work pressure. Automated performance monitoring gets you out of the “no time to calculate it” trap, and lets you make employee performance management decisions with confidence.
Rahul Saxena is the founder and chief analytics officer of FrogData. Contact him at rahul.saxena@bobit.com.
Originally posted on F&I and Showroom
More Dealer Ops

Ladies and Gentlemen, This Is a Dealership: Why the Fundamentals Still Decide Who Wins
A teaching moment by a legendary football coach happens to apply perfectly in the auto retail space. Learn what it is and how to use it to your store’s advantage.
Read More →
Timing the Market Can Hurt Long-Term Program Performance
For dealer-owned reinsurance entities, avoiding volatility entirely can mean falling behind inflation and missing market rebounds that drive long term surplus growth. Missing just a handful of strong market days can materially impact cumulative returns—an important reminder for long horizon trust and investment strategies.
Read More →
Dealer Ads and the FTC
The agency has made it clear in recent enforcement actions and warnings, in auto retail and other industries, that advertised prices must include all nonoptional costs to the consumer.
Read More →
Used Autos Supply Dwindles
The March shopping surge, despite high prices, cut into inventory by the most since the thick of the pandemic, Cox Automotive analysts calculated.
Read More →
Managing Risk Effectively Through Changing Times
The variables influencing risk pricing have changed significantly over the past five years. Being proactive and responsive to emerging trends is not optional but essential.
Read More →
Survey Reveals What Won't Fix What's Breaking Car Sales
AutoPayPlus says extra-long auto loans are trapping consumers and threatening the dealer trade-in cycle, and that the industry is leveraging the wrong tools to combat high MSRPs.
Read More →
IA American Appoints Two Execs
Senior vice presidents of the company's agent and dealer channels chosen to support general agents and help auto dealers with sales and performance.
Read More →
Cox Automotive Acquires Inspection Firm
Full ownership of Alliance Inspection Management, or AiM, meant to unlock growth for Manheim inspection capabilities
Read More →
Assurant Expands Partnership With Holman
Extended collaboration delivers training, products and performance development to 30 newly acquired Holman dealerships
Read More →
Franchises, Throughput Down in First Half
A handful of states see franchise growth through June, while EV sales per store boost overall business in U.S.
Read More →