
Looking Back Before Moving Forward
Ryan Linnehan - They say, “Hindsight is 20/20.” Well, I’m not sure who “they” are, but “they” do bring up a good point. The passage of time will often provide us with a new perspective as we review the results of what has already happened. Not only that, but ...

They say, “Hindsight is 20/20.” Well, I’m not sure who “they” are, but “they” do bring up a good point. The passage of time will often provide us with a new perspective as we review the results of what has already happened. Not only that, but it allows us to spot some trends that may not have been as obvious without the benefit of being able to look at the information over time.
As we move forward into a new year and make plans for how to get to where we want to be, it would be beneficial to take some time to first review where we’ve been. One great tool for looking at recent trends in our industry is the NIADA Used Car Industry Report. NIADA is a great organization that I hope all dealers support. The information they compile and distribute in this report can be very valuable. Here are some of the highlights that caught my eye in the 2008 report.
Jump in BHPH Dealers
The percentage of respondents that stated their type of business was BHPH increased from 13.2 percent in 2006 to 25.6 percent in 2007 (the latest year the data was available for this report). That’s a huge jump! It could just mean more dealers are “dabbling” in BHPH, and that may continue as the economy worsens (although the negative cash flow and large initial investment are definitely barriers to entry, now more then ever). The lesson to learn is any increase in competition is a threat to take a piece of your pie, so it is crucial to make sure all your people and processes are as sharp as possible so your market share isn’t eroded.
Over 7,000 Fewer Independent Dealers Since 2004
Between 2004 and 2007, the number has dropped each year from 49,896 in ‘04 to 42,791 in ’07. Judging by the current economy, most experts believe that declining trend will continue in ‘08, and probably into ‘09 as well. It will be interesting to see if more franchise dealers abandon (either voluntarily or involuntarily due to merger, bankruptcy, etc.) the manufacturers and transition their model to become independent dealers.
Increase in Dealer Web Sites, but …
The number of independent dealers reporting they have Web sites has increased nearly 15 percent from 50.7 percent in ‘06 to 57.5 percent in ‘07. I think that increase isn’t as remarkable as the fact that over 42 percent of independent dealers still didn’t have a Web site! If you don’t think a full-featured site is necessary, or the bare minimum of having an “electronic brochure” posted online, then you have likely made your competitors happy!
Slight Increase in Use of Payment Protection Devices
I’m always curious to see what the national trends are in regards to these devices. We have discussed in the past the pros and cons of these and why many dealers don’t use them, but I’ve been interested to see if their usage will become more prevalent among more-established BHPH dealers. Perhaps the increase in usage of these devices is also a function of the large increase of BHPH dealers that I mentioned earlier.
Use of Classified Advertising Continues to Drop
It’s still by far the most widely used of all the ad media, utilized by just under 90 percent of independent dealers in 2007, but considering over 96 percent of dealers used the classifieds in 2004, the numbers confirm that newspaper advertising may be on the slow road to obsolescence. I believe as more dealers utilize effective BDCs and call tracking programs, we will see more erosion in this area. Once we began tracking our data, we found this advertising source to have a very high cost per sale.
Used Vehicle Sales to “D Paper” Customers hits $33 Billion
For most BHPH dealers, that is our market! Though the total used vehicle sales by independent dealers has decreased slightly since 2004, the amount of sales to customers in the “D Paper” category has increased from $30.7 billion to $33.28 billion. Again, with the volatile economy and current pullback by subprime finance companies, it seems like BHPH dealers will see even more opportunity going forward.
Steady Increase in Weekly Payment Amounts
In 2004, the average weekly payment that BHPH customers were paying was $76. In 2007, that had risen all the way to $85 per week. We have seen the same type of increase in our dealership as well, and it may partly be just a reality of the industry today. However, the first two words that popped in my head when I saw this metric was: Be careful!
After all, payment-to-income was one of the areas the subprime mortgage lenders ignored at their own peril, which helped lead to the meltdown that is dragging down the economy. I do believe that BHPH dealers are better off, since we are collecting the payments weekly, instead of relying on the budgeting discipline of our customers. This is a number we will closely monitor in our own operations, particularly as our customer’s disposable income gets tighter and tighter.
I encourage you to learn what you can, not only from looking at the national data available to you, but also from looking at your own company’s historical data. Look for trends you can identify over time. You may see certain areas trending exactly the way you want them to. If you find areas that are not, once you identify them and develop a plan of attack to address those areas, you will have a great action plan for making the new year as successful as possible!
More Dealer Ops

Ladies and Gentlemen, This Is a Dealership: Why the Fundamentals Still Decide Who Wins
A teaching moment by a legendary football coach happens to apply perfectly in the auto retail space. Learn what it is and how to use it to your store’s advantage.
Read More →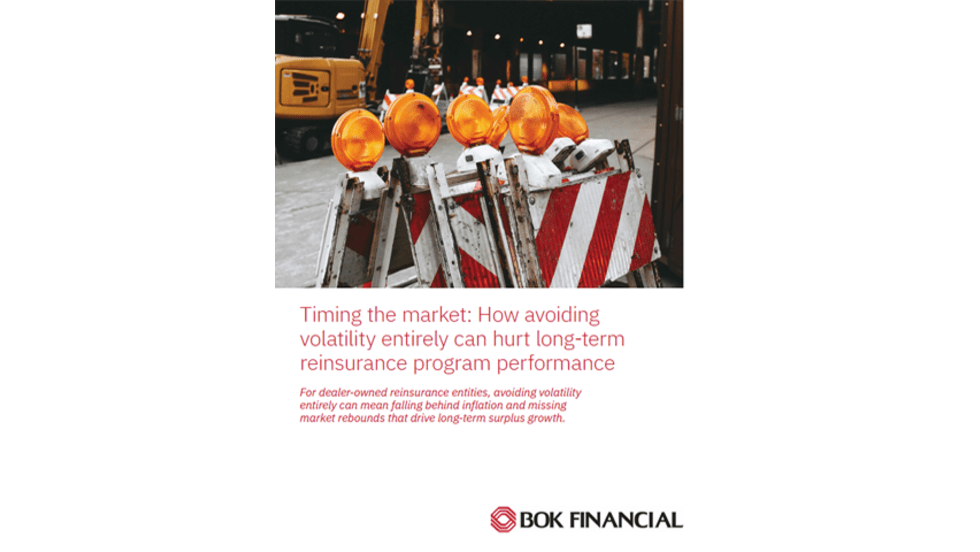
Timing the Market Can Hurt Long-Term Program Performance
For dealer-owned reinsurance entities, avoiding volatility entirely can mean falling behind inflation and missing market rebounds that drive long term surplus growth. Missing just a handful of strong market days can materially impact cumulative returns—an important reminder for long horizon trust and investment strategies.
Read More →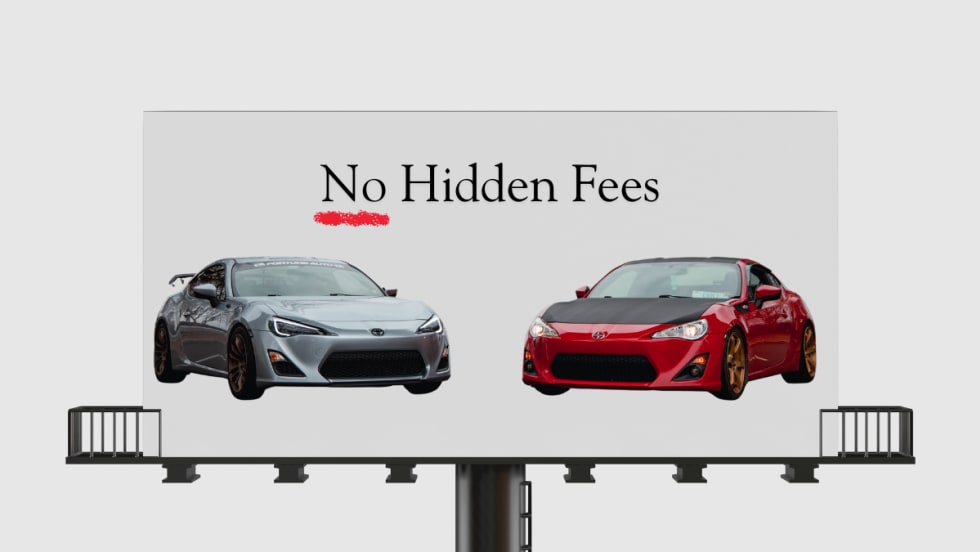
Dealer Ads and the FTC
The agency has made it clear in recent enforcement actions and warnings, in auto retail and other industries, that advertised prices must include all nonoptional costs to the consumer.
Read More →
Used Autos Supply Dwindles
The March shopping surge, despite high prices, cut into inventory by the most since the thick of the pandemic, Cox Automotive analysts calculated.
Read More →
Managing Risk Effectively Through Changing Times
The variables influencing risk pricing have changed significantly over the past five years. Being proactive and responsive to emerging trends is not optional but essential.
Read More →
Survey Reveals What Won't Fix What's Breaking Car Sales
AutoPayPlus says extra-long auto loans are trapping consumers and threatening the dealer trade-in cycle, and that the industry is leveraging the wrong tools to combat high MSRPs.
Read More →
IA American Appoints Two Execs
Senior vice presidents of the company's agent and dealer channels chosen to support general agents and help auto dealers with sales and performance.
Read More →
Cox Automotive Acquires Inspection Firm
Full ownership of Alliance Inspection Management, or AiM, meant to unlock growth for Manheim inspection capabilities
Read More →
Assurant Expands Partnership With Holman
Extended collaboration delivers training, products and performance development to 30 newly acquired Holman dealerships
Read More →
Franchises, Throughput Down in First Half
A handful of states see franchise growth through June, while EV sales per store boost overall business in U.S.
Read More →