
COVID-19 Market Insights
Black Book recently published an update to their weekly COVID-19 Market Updates, including wholesale prices, retail listing prices, wholesale sold volume, and used retail listing volume.

Black Book recently published an update to their weekly COVID-19 Market Updates, including wholesale prices, retail listing prices, wholesale sold volume, and used retail listing volume.
IMAGE: Black Book
BLACK BOOK – Here is a quick recap of the headlines from the last week:
Wholesale prices continue their ascent in August, but at a slower pace than the majority of July.
Retail listing prices took a break from increases and were stable last week, still above pre-COVID-19 levels.
Wholesale sold volume continued to be lower compared to last year in the last few weeks, as used inventory remains limited and many dealers are searching for alternative ways of acquiring inventory.
Used retail listing volume has stabilized at levels significantly lower than last year due to two factors: overall used inventory is lower, while many units in good condition are presold before they even get listed online.
Weekly initial unemployment claims dipped under the one million mark for the first time since April.
The preliminary University of Michigan’s Monthly Consumer Sentiment Index for August was released last week – it is essentially unchanged from July and remains low.
Extended federal unemployment benefits expired on July 31st. The two sides in the Senate are at an impasse, and negotiations are not expected to produce any results until after Labor Day, at the earliest. Without substantial and sustained federal stimulus, demand for used vehicles is expected to deteriorate.
Hertz Global Holdings said in a regulatory filing on Monday that it is looking for new sources of financing as rental revenue collapsed in the second quarter – Hertz posted a net loss of $847 million.
Last Week’s Highlights from the Wholesale Market
Volume-weighted, overall car and truck segments both showed gains for the twelfth week in a row, increasing 0.82% overall this week (compared to 1.08% the prior week). As for specifics, the overall car segments increased by 0.65% (compared to 1.03% the prior week), and the overall truck and SUV segments increased again this past week at 0.91% (compared to 1.10% the prior week).
The graph below shows week-over-week depreciation rates for the entire market, including Cars and Trucks/SUVs/Vans for the last several months. We have now experienced twelve weeks of overall market rebounding with consistent week-over-week increases in almost all segments.
News from the Retail World (Used and New)
To secure inventory, dealers are widening their search area, but this is now leading to another challenge – transportation. Transportation costs have increased, especially on partial loads.
Retail worthy trade-ins are more important than ever, as this is the easiest way for a dealer to obtain used inventory. With the elevated cost of obtaining inventory at auction and increased challenges in securing transportation, it is beneficial for dealers to step up in the price they are offering consumers for their trades.
Dealers continue to report that sales are down, but not for the reason you may think. It’s not for a lack of demand, but instead a lack of supply, both new and used.
What Comes Next?
As more used inventory reaches the market and consumer demand weakens, we expect wholesale prices to stabilize, and possibly decrease, as early as Labor Day.
We expect a large, incremental influx of used inventory to hit the marketplace starting in September and lasting into the beginning of 2021, coming from prolonged lease return delays and downsizing of rental fleets. In addition, lenders expect a significant increase in delinquencies and repossessions over the upcoming months as the economy continues to feel the effects of high unemployment. With much weaker retail demand, and a projected oversupply of used inventory, we forecast a significant drop in wholesale prices this fall, relative to the heights seen in recent weeks.
Longer Term View
Although the economic effects of the pandemic will continue to be felt as far out as three years from now (e.g. according to the recent CBO economic outlook report, the unemployment rate will not return to pre-COVID levels for at least a decade), we still project that wholesale vehicle values will return to the pre-COVID-19 baseline by 2023. Used supply will decline due to cuts in retail and fleet sales throughout 2020 and into 2021.Page Break
Economic Conditions
Job Market
Since the beginning of April, weekly initial unemployment claims remained at record levels. Last week, the Labor Department reported that the US added 963 thousand new jobless claims. This is the first week since the beginning of this recession that initial claims fell below the one million mark. Since March, we have seen 21 consecutive weeks of record level layoffs and furloughs. The graph below compares weekly initial unemployment claims from the current recession against the Great Recession of 2007 – 2009. The severity and speed of job losses is unprecedented. The horizontal (x) axis is an offset (in months) from the beginning of the recession, week 0 being the week of March 21st.
In the early stages of the crisis, the US unemployment rate in April skyrocketed to 14.7%, the highest monthly rate since the Great Depression. The May unemployment level decreased to 13.3% due to the success of the Federal Paycheck Protection Program (PPP) and other stimulus measures enacted in part by the Federal Reserve and Government. As the country and the economy continued to reopen during the early part of June, the monthly unemployment numbers eased further to 11.1% and dropped to 10.2% in July. The Labor Bureau also noted in its reports that there was a classification error in its surveys, and the real unemployment numbers were actually higher for each month since March, as illustrated below.
There is a concern that without further federal stimulus, these gains will be temporary and employment numbers may deteriorate. According to a recently released CBO report, “the unemployment rate is projected to peak at over 14 percent in the third quarter of this year” before declining in the fourth quarter.
This recession is very different and unprecedented in the labor market – reflecting an almost instantaneous jump in unemployment with projected fast growth within a year. The graph below compares unemployment rates for the last several major recessions. The horizontal (x) axis is an offset (in months) from the beginning of the recession.
Although we have seen a reduction in unemployment claims, the initial economic shock and job losses have created a deep hole for us to dig ourselves out of. Between February and the end of July, the nation lost close to 12.9 million jobs.
Consumer Confidence
With a weakening of the economy and the increase of new COVID-19 cases across the South (which is now expanding to other hot spots across the country), consumer confidence dropped back to the lows of April. The University of Michigan’s Monthly Consumer Sentiment Index for July, released at the end of July, decreased to 72.5 points, and the preliminary projection for August is 72.8. The report also predicts a further weakening in consumer confidence: “unfortunately, declines are more likely in the months ahead as the coronavirus spreads and causes continued economic harm, social disruptions, and permanent scarring.”
Not surprisingly, consumer confidence has been on a bit of a rollercoaster the last five months. At the beginning of the year, it was strong – the University of Michigan’s Monthly Consumer Sentiment Index in February was 101 points. As the COVID-19 pandemic spread across the US, the Index dropped to 71.8 points in April and increased slightly to 72.3 points in May. During recent testimony by Federal Reserve Chair Jerome Powell, he noted that during the months of April and May, “stimulus checks and unemployment benefits are supporting household incomes and spending.” With these one-time stimulus payments and extended unemployment benefits helping the economy, the Index for June increased further to 78.1. The gains, however, were not uniform across the country. With a significant reduction in the number of COVID-19 cases, the Northeast region led the way with a record 19.1 point month-over-month jump, while the Southern region rose just 0.5 points due to the dangerous increase in numbers of new infections and fear of further shutdowns.
Gross Domestic Product (GDP)
The Bureau of Economic Analysis published an advanced estimate on GDP in the second quarter – real GDP decreased at an annual rate of 32.9%. This was the highest drop in GDP ever recorded.
Consensus states that the economy will start to grow in the third quarter compared to the previous one. Current “nowcast” from GDP Now model [from the Federal Reserve] estimate for real GDP growth (seasonally adjusted annual rate) in the third quarter of 2020 was 26.2% on August 14th.
Delinquencies in Automotive Lending
The number of accounts in ‘hardship’ jumped substantially in April and kept increasing through June across all risk groups, according to the Monthly Industry Snapshot by TransUnion. Currently, more than 7% of all accounts are in hardship – this is almost a 1,700% increase over last year. The increases are across all risk tiers. As deferrals expire in the upcoming month, coupled with a high unemployment rate, lenders expect a large portion of these ‘hardships’ to become delinquencies.
According to the “Senior Loan Officer Opinion Survey on Bank Lending Practices” from the Federal Reserve, lenders started to tighten standards on auto loans in the first half of 2020. Recently released results from the second quarter showed a substantial increase in the number of banks that tightened their standards.
Gas Prices
Gasoline prices reversed the May trend and then started to increase. Since their lowest point at the end of April, prices are up $0.39, to $2.17 per gallon last week and holding steady for the last several weeks, according to the U.S. Energy Information Administration.
Current Wholesale Market Overview
Auction Insights
New inventory deliveries are increasing, but not at a fast-enough pace, especially when it comes to Full-Size Pickups and Crossovers/SUVs. The demand for these units continues to be strong on the lanes, with bidding activity pushing the values higher and higher each week. Remarketers continue to push their luck by raising floors each week and buyers are stepping up to be the successful buyer.
The open auction environment is the place to be, with sellers reporting strong success when they are able to get their vehicles into a competitive bidding environment. Sellers are enjoying the competition that is happening between the big buyers like Carmax, Carvana, and Vroom.
Auctions have always had a competitive nature, but in this supply-stricken market, the competition has been taken to a new level. Some sellers are now only wanting their vehicles to be offered for sale in the open bidding environment, as they are finding this is warranting a higher success rate and increased dollar value compared to upstream sales channels.
With complaints around condition reporting accuracy continuing to be a commonality, a seller’s reputation is more important than ever. Sellers with a solid reputation for offering quality used units have an advantage with buyers now willing to step up in price on units from a trusted seller.
Auction Volume
Despite most auctions continuing to operate under an all-digital platform, sales volume has rebounded to a level consistent with this time last year. This is being driven by strong retail sales, consumer demand, and the need to backfill, leading dealers to use auctions as their main source of inventory. The number of sales bottomed out around an 80% year-over-year decline when most auctions closed their physical sales (and some closed entirely) at the end of March. The graph below illustrates the estimated year-over-year change in sales volume of the wholesale market. The red line is the base line, and any dots above the line indicate higher amounts of sales vs. the prior year.
Sales Rate
At the onset of the pandemic, as shelter-in-place orders went into effect, sales rates quickly tumbled into the teens, but rates began climbing each week and have now stabilized. Independents that have been operating a traditional physical sale continue to report the highest sale rates, many consistently exceeding 70% week after week. Black Book’s estimate of the overall Weekly Average Sales rate is presented below.
Current Wholesale Price Trends
Current Market Level View
Volume-weighted, overall car segment values increased 0.65% this past week. This is the lowest level of increase since the second week of June, when the values first began large week-over-week increases. This past week we saw the highest-volume Car segment, Compact Cars, slow down the appreciation with an increase of 0.57%, compared to 1.21% the prior week. When volume-weighting is applied, the overall Truck segment (including pickups, SUVs, and vans) values increased by 0.91% last week. This is only slightly lower than the increase seen the prior week of 1.10%. Full-Size Trucks continued their ascent with an increase this past week of 1.48%, the largest increase of all the reporting segments. The lack of available new inventory is a big driver of this increased demand for used Full-Size Trucks.
Black Book’s Seasonally Adjusted Retention Index
The graph above compares Black Book’s Seasonally Adjusted Retention Index for the 2019 and 2020 calendar years. The Black Book Used Vehicle Retention Index is calculated using Black Book’s published Wholesale Average value on two- to six-year-old used vehicles, as a percent of original typically-equipped MSRP. It is weighted based on registration volume and adjusted for seasonality, vehicle age, mileage, and condition. The Index offers an accurate, representative, and unbiased view of the strength of used vehicle market values. It measures an ‘apples-to-apples’ year-over-year retention comparison.
2020 started slightly below 2019 levels, but the market showed early strength in February and March. As the US economy shut down due to the COVID-19 pandemic, we measured the highest single month drop in April of 6.9 points since launching the Index. As we entered July, wholesale prices continued the rebound that began during the second half of May and continued through the month of June, with June’s Retention Index climbing back to pre-COVID-19 levels, with a record jump of 9.1 points. Recently released, July’s Index value jumped above 2019 to 126.0 points as wholesale prices continue their climb. Our current “nowcast” for August stands at 124.1, a slight decline from July, but 6% above 2019 levels.
During the last recession (2007-2009), the Index declined by about 15 points in a span of 12 months before recovery started. We project that the Index will decline over the next five months after the summer’s strength.
Segment Highlight – Full-Size Luxury Crossover/SUV segment
Segment Overview
The Full-Size Luxury Crossover/SUV segment is a very small portion of the overall market, roughly 1%. It may not be a large part of the market, but the offerings in this segment have high-end luxury finishes and offer some of the latest technology. This segment provides the utility that consumers need with the amount of available cargo space but is still seen as a status symbol. The largest players in this segment are the Cadillac Escalade, Mercedes-Benz GLS, Land Rover Range Rover and Range Rover Sport, and Infiniti QX80. Land Rover has three participants in this segment: Range Rover, Range Rover Sport, and Range Rover Velar. The Range Rover Velar along with the BMW X7 are relative newcomers to the segment, with entry in 2017 and 2019, respectively.
Historical Trends
The Black Book Retention Index for the Full-Size Luxury Crossover segment has been less volatile throughout the pandemic as compared to some of the higher volume segments. The high price point puts it into a class of buyers that requires a larger income, as many of the vehicles in the segment can have MSRPs over $100,000. During the 2008/09 recession, the Index took a large hit, as that recession heavily impacted higher income earners, as compared to the COVID-19 pandemic that has tended to have a larger impact on lower to middle-income earners that were without work during the stay-at-home orders. The overall market level Index dropped a record-breaking -6.9% in April, but the Full-Size Luxury Crossover segment only dropped –4%.
Recent Depreciation Rates
Overall, the depreciation of the Full-Size Luxury Crossover/SUV segment has trended similarly to the overall market, with a large drop in values at the beginning of the shutdowns and has followed with an uptick in values throughout June and July.
Model Spotlight – 2021 Cadillac Escalade
The Cadillac Escalade is arguably the most well-known model offered by Cadillac. It represents style and status for its buyers and for the 2021 model year it is receiving a full redesign in the form of a fresh design, a new optional engine, and independent rear suspension. The 2021 comes standard with the previous generations 6.2-liter V-8, but the latest option to this iconic vehicle is the Duramax turbo-diesel 3.0-liter inline-six, available at no additional change. As for pricing, starting MSRP is $84,290 for the Premium Luxury. Super Cruise, Cadillac’s driver assistance technology, is an available option that offers on-demand lane change. Look for it to hit dealer lots later this year.
Source: Car and Driver
Used Wholesale Price Projections
Wholesale Price Impact Under the Most-Likely Economic Scenario
Wholesale prices dropped significantly in April as uncertainty over COVID-19’s impact and response dampened vehicle demand, resulting in an overall wholesale price decline of 5.9%. We saw a substantial improvement in prices during the last two weeks of May, and the monthly decrease was limited to only -1.5%. In June, wholesale prices continued to increase, and the overall market appreciated by a record 5.7%. As a comparison, last year’s prices declined by 0.9% over the same period. Wholesale prices increased by a record 7.0% in July.
Short-Term Outlook (Fall of 2020)
Black Book’s August Published Residual Values (dashed lines) reflect a new economic reality. Once the temporary strengthening during the summer months passes, we project values to stay below our pre-COVID-19 forecast over the next two years, with the deepest declines expected over the next five months. The green line represents our most-likely economic scenario, which does not include a possible second wave of COVID-19, as well as a still undefined second stimulus package. A more severe and prolonged recessionary scenario is shown in red. Projections are indexed to the pre-COVID-19 projections (black line). All values are weighted by the used vehicle sales volume (actual, where available, or projected).
We project a drop in wholesale prices compared to a pre-COVID-19 baseline this fall, as the US economy suffers through the effects of COVID-19. We anticipate that later this fall, wholesale prices will be approximately 5% to 10% lower than originally projected before the pandemic, due to a glut in supply and much weaker demand. Prices will start to recover in 2021 as the economy becomes stronger. We also anticipate that older (>6-year-old), cheaper vehicles in average condition will not decline as much due to increased demand for these units. Additionally, we project that newer (zero- to one-year old) models in good condition will retain their strength in the near future due to the continuous shortage of new inventory.
Long-Term Projections (36-Month Residual Values, Fall of 2023)
The effects of the pandemic will continue to be felt out to 36 months from now. We project that values will return to the pre-COVID-19 baseline as used supply will decline due to cuts in retail and fleet sales throughout the remainder of 2020 and into 2021.
Wholesale Price Impact Under a Severe Recession Scenario
In this scenario, we project a decrease in wholesale prices of up to 15% in early 2021, compared to a pre-COVID-19 baseline, with a slow recovery in the second half of the year. The effects of the pandemic and recession will still be impactful in 36 months, and we project a 10% market level decline of wholesale prices as compared to pre-COVID-19 projections for the second half of 2023.
Used Retail Vertical
Used Retail Prices
With the proliferation of ‘no-haggle pricing’ for used-vehicle retailing, asking prices accurately measure trends in the retail space. From the peak in early April until the end of June, retail listing prices decreased by about 4%. Since the second week of June, we saw an increase in used retail prices fueled by higher consumer demand due to stimulus payments, the federal Paycheck Protection Program (PPP), and limited used and new inventory. In the last three weeks, used retail prices rebounded to above pre-COVID-19 levels. The prices stabilized in the last two weeks. We expect used retail prices to decline later in the fall as stimulus payments are exhausted and the protection in PPP expire.
Used Retail Inventory
Many dealers continue to report a shortage of used inventory in the wholesale marketplace. As a result, from the peak in February, we’ve seen a decline in the number of used retail listings by about 25%. The true shortage of vehicles is probably not as severe as this decline would lead you to believe, as many dealers sell some of their best inventory in the first several days before listing them online. Nevertheless, the shortage of used inventory helps keep retail prices elevated even in the weak economic conditions.
The graph above shows the weekly average of the number of retail listings collected by Black Book, indexed to the first week of the year. We see a continuous decline in the numbers starting at the beginning of May as the economy started to open in the states outside of the Northeast.
We started 2020 with active retail listings above the previous year’s levels. By July, the listing volume dropped to about 8% below 2019 numbers. Currently, the number of listings is about 10% lower compared to last year. Scarcity of used inventory is the main reason for this shortage of retail vehicles for sale. Another important factor that may cause the numbers of listings to decrease is that some of the inventory is sold before it has a chance to be listed online.
Used and Used Retail Insights
Sales, both new and used, continue to be down, but not due to a lack of demand. Overall, many dealers continue to report being down as much as 50% of their typical inventory levels, which they say is the cause of their lower sales.
The lack of new inventory has given a boost in demand to CPO units and quality low mileage, newer model year used units. These units are getting harder and harder to find at auction. The expectation is that the demand for these hard to find units will continue until new vehicle deliveries reach a normal level.
To secure inventory, dealers are starting to widen their search area, but this is now leading to another challenge, transportation. Because of the increased demand for auto transports, dealers are having a hard time finding transport companies that will move partial loads and the companies that will take a partial load have increased their rates.
COVID-19 related employee absenteeism at auto manufacturing plants continues to cause slowdowns in production. Supply chain delays also continue to dampen the ability for the manufactures to keep plants operating at full capacity.
Used Retail vs. Wholesale Prices Trends
Each week, members of the Black Book automotive analyst team, data science team and executive leadership team speak with no less than 30 dealers, along with buyer and seller representatives, wholesalers and others, who represent hundreds of franchise and independent dealers nationwide. These industry experts, along with experts we speak with from leading fleet management and rental car companies, auction leadership, and other industry experts, help to clarify and connect the dots between the wholesale and retail markets, adding to the insights that our data reveals.
Since the start of the pandemic, we have been observing different trends in both wholesale and retail prices (see graph below). In April and May, wholesale prices declined at a higher rate compared to retail prices. As margins grew, dealers reported healthy profits on a per vehicle basis. Retail prices displayed stickiness on the way down. Similarly, as wholesale prices came roaring back to pre-COVID-19 levels, retail prices are slow to recover, exhibiting the same stickiness on the way up. As wholesale to retail margins shrink, it is even more important for dealers to stay up to date on market movements. We are seeing this trend play out on dealership lots, where retail asking prices are not increasing at the same level as wholesale transaction prices. This means dealers are paying more at auctions and through wholesale channels, but those increased wholesale acquisition prices, as a percentage, are not flowing through to the retail lots and online listings, and ultimately to the consumer. The main driver of the slow increase in retail prices, based on our conversations with dealers, is simply the fear of sitting on inventory for too long, coupled with the added risk that the market makes a quick reversal, which leaves them stuck with a vehicle they paid too much for. Dealer sentiment is quite clear—if they are going to pay up for a vehicle in this environment, they are choosing to turn them quickly, even with less margin than normal, to ensure they are not caught with high priced inventory when the market does shift. There is no long game here. There is simply a need to fulfill demand in a risk filled environment.
The graph below shows this retail / wholesale dynamic since the start of the year. Prices are indexed to the first week. The black line is Black Book’s Retention Index (not adjusted for seasonality). It is calculated using Black Book’s published Wholesale Average value on two- to six-year-old used vehicles, as a percent of original typically-equipped MSRP. It is weighted based on registration volume and adjusted for vehicle age, mileage, and condition. The blue line is a retail index – average listing price of available retail inventory adjusted for mileage.
CPO Retail Sales
Certified Pre-Owned has grown in popularity as it provides consumers with an affordable used purchase option with low mileage (a typical 3-year-old CPO vehicle will have around 5,000 less miles than a similar non-CPO vehicle), but with the peace of mind that comes with a new purchase with the additional warranty. Some OEMs also offer special financing rates and terms for their CPO vehicles. For dealers, the cost to certify a vehicle is typically minimal and the return on the retail is typically greater. CPO vehicles are typically viewed as nicer condition units as there are minimum criteria a vehicle must meet to be able to be certified, and these typically involve age and mileage restrictions.
There are additional benefits to consumers that purchase through certain OEMs, including GM, who offers an exchange program on their Chevrolet and GMC CPO units. If the customer changes their mind within three days or 150 miles, the purchaser can exchange it for any Buick, Chevrolet, or GMC CPO vehicle. Nissan is improving their CPO program by adding additional benefits such as $750 Captive Cash on all CPO Rogue and Rogue Sports and adding one-year complimentary pre-paid maintenance when a CPO vehicle is financed through NMAC.
For some dealers, there is additional incentive to CPO a certain percentage of their used inventory as it bumps up their status with the manufacturer. For example, BMW takes into consideration a dealer’s CPO sales volume when deciding on the dealership’s new car allocation.
Cost of certifying a vehicle ranges by manufacturer. Typically, for mainstream OEMs, the cost to the dealer is $500 or less per vehicle, but luxury vehicles can reach into the thousands of dollars and vary by model. In most cases, the full cost to CPO a vehicle is the responsibility of the dealer, including any reconditioning that is necessary for it to receive certification.
Retail prices of CPO vehicles are generally about 3.5% higher than a similar non-CPO vehicle (adjusted for mileage). Similar to the cost to CPO a vehicle, the difference varies among the segments and, for example, can climb to about 7% for near luxury sedans.
New Vehicles Sales Outlook
Our New Vehicle Sales Outlook remains unchanged from last week. We anticipate a significant reduction in US new vehicle sales in 2020 (both retail and fleet sales) due to continued reduction in consumer demand. This is the result of several ongoing factors, including less miles driven due to remote work and shelter-in-place initiatives, high unemployment, and an overall feeling of uncertainty by consumers. Overall, new sales were down 22% during the first seven months of the year compared to last year (with a 12% YOY decline in July). Even as OEMs are restarting assembly lines, there are significant challenges ahead in order to return to a normalized production schedule as we reported in previous updates. The graph below shows our current projections for new vehicles sales for the remainder of 2020.
Due to continuous production disruptions and much weaker demand due to economic slow-down, we project a 25% drop (compared to pre-COVID-19 projections) in new sales in 2020 to 12.7mm units in our base economic scenario. In a deep economic recession scenario that is still possible this year, we project a 40% drop in new sales in 2020 to 10.2mm units as economy dips into a prolonged recession.
In the longer-term, we expect new sales volume to return to pre-COVID-19 levels within five years.
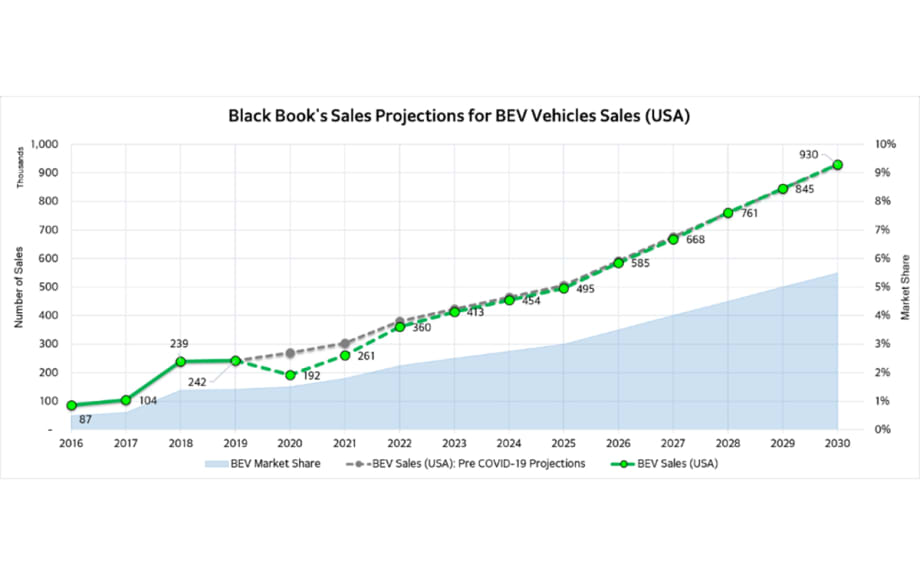
BEV Sales Outlook
As fast charging infrastructure continues to expand, we expect a slow growth in the battery electric vehicles (BEV) market in the next 2-4 years. Stronger growth is projected after 2025, but we do not expect a large shift to BEVs in the US market in the next 10 years, with market share only exceeding 5% by the decade end. Our current view is that growth in BEV demand will be evolutionary and not revolutionary.
Without substantial change in government policies (state and federal levels), we do not project a wide adoption of BEVs outside several states like California. As federal incentives decline, several states (especially CA) will increase rebates for lower priced BEVs to accelerate adoption. BEV prices are still projected to be substantially higher than comparable internal combustion engines (ICE) for the next 3-4 years.
Projections below include only light duty on-road vehicles as defined by Federal Highway Administration.
All the recent growth in the BEV market has come from Tesla: more than ¾ of all recent sales are Tesla models. There will be many new non-luxury (e.g. Ford, Nissan, and Volkswagen) and luxury (e.g. Mercedes-Benz and Infiniti) entrants into the market for 2021/22 model years.
Used Vehicle Supply Projections
Black Book projects a higher than expected used vehicle supply in the wholesale marketplace for the rest of 2020 due to several factors:
Delayed lease returns resulting from lease extensions offered by OEMs – more than 560,000 additional three-year-old units in the second half of 2020
Extensive de-fleeting by rental car companies due to lack of consumer and business traveler demand and financial pressure to raise cash – at least 250,000 one- to two-year-old vehicles will be added to the market in the second part of 2020
Dramatic reduction in auction activities due to COVID-19 in March, April, and May
Increased repossessions due to deteriorating economic conditions in addition to delayed repossessions during spring and summer months – we expect the volume of repossessed vehicles to at least double in the next six months compared to last year
Short Term Lease Return Projections
When we started the year, lease returns were projected to hit a record volume of above 4.1 million units. Once the pandemic was underway and most manufacturing stopped, OEMs started to encourage lease extensions in order to push returns further into 2020, when they would be able to provide replacement vehicles. As a result, we project at least 560,000 additional units in the second part of 2020 (compared to the pre-COVID-19 estimates) due to a slowdown in sales in April / May, along with expected turn-ins of the lease extensions.
Rental Unit Returns
Business and leisure travel collapsed at the end of March – air travel is still down by more than 70% according to the TSA. We expect a significant reduction in both categories for the remainder of 2020. In addition, there is no expectation that travel will return to pre-COVID-19 levels over the next several years. According to the IATA (International Air Transport Association), air travel will not return to pre-COVID-19 levels until after 2023. This puts tremendous financial pressure on rental companies that rely on air travel to reduce both their current fleet and scrutinize future vehicle acquisitions.
At the end of May, Hertz filed for bankruptcy in North America as a result of the pandemic. Several weeks ago, Hertz was able to secure a deal with its lenders that allows a gradual reduction of fleet – over 182,000 units between June and December (it was estimated that between 20,000 and 30,000 of these units were already sold). In addition to Hertz, we expect other rental companies will continue to reduce their fleet during the fall months to match lower demand for rentals. This practice will lead to over 250,000 additional rental units hitting the wholesale market in the second half of 2020.
The graph below shows Black Book’s projections for rental returns. The purple line shows the difference between current (darker rectangles) and pre-COVID-19 projections (lighter rectangles).
In the longer term (later 2021 – 2023), the drop in rental return volume will benefit the price of newer used units, as supply will be limited.
Longer Term Used Returns Projections
With the reduction in retail and fleet sales over the next several years, we project approximately 75k used units per month less in the market in 2023, compared to previously projected returns. This lower level of used inventory will be beneficial to used car prices as supply will be limited, helping to bolster valuations.
Originally posted on F&I and Showroom
More Dealer Ops

Dealer Debrief: Defection Data & EV Updates
In this week's debrief, host Lauren Lawrence discusses how to use defection data to your advantage and the latest on EV sales and charging infrastructure.
Read More →
How Defection Data is Bridging the Dealership Conversion Gap
Lead volume is flat, cross-shopping is up and brand loyalty is in retreat. As confident sales teams keep losing buyers they thought they had, daily industry sales data is showing dealers exactly where their funnel is breaking and how to fix it without buying a single new lead.
Read More →
Dealer Debrief: Where are you losing customers?
In this week's debrief, host Lauren Lawrence discusses the hidden leaks in dealerships where you might be losing customers without even realizing it.
Read More →

Dealer Debrief: Improving Your Inventory Management
In this week's debrief, host Lauren Lawrence covers a new survey that shows what service technicians really want and two launches that could help improve your inventory and vehicle life cycle management.
Read More →
Ladies and Gentlemen, This Is a Dealership: Why the Fundamentals Still Decide Who Wins
A teaching moment by a legendary football coach happens to apply perfectly in the auto retail space. Learn what it is and how to use it to your store’s advantage.
Read More →
What Market Timing Mistakes Mean for Your Reinsurance Program
When volatility hits, dealer-owned reinsurance programs face a familiar temptation: pull back and wait for calmer waters. New data from BOK Financial shows why that instinct can quietly cost you years of surplus growth.
Read More →
Dealer Ads and the FTC
The agency has made it clear in recent enforcement actions and warnings, in auto retail and other industries, that advertised prices must include all nonoptional costs to the consumer.
Read More →
Used Autos Supply Dwindles
The March shopping surge, despite high prices, cut into inventory by the most since the thick of the pandemic, Cox Automotive analysts calculated.
Read More →
Managing Risk Effectively Through Changing Times
The variables influencing risk pricing have changed significantly over the past five years. Being proactive and responsive to emerging trends is not optional but essential.
Read More →
Survey Reveals What Won't Fix What's Breaking Car Sales
AutoPayPlus says extra-long auto loans are trapping consumers and threatening the dealer trade-in cycle, and that the industry is leveraging the wrong tools to combat high MSRPs.
Read More →