
Black Book: Weekly Market Update
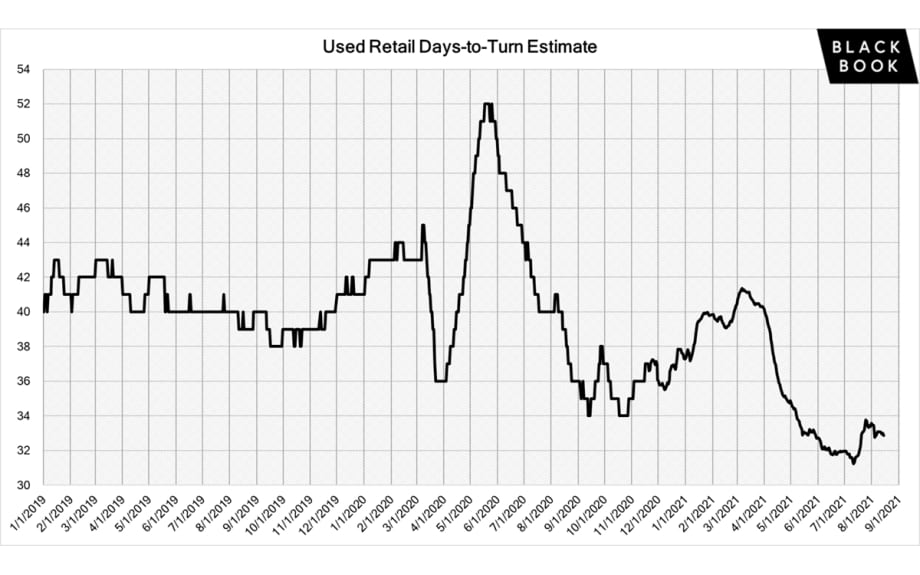
Days-to-turn for used retail listings have been increasing, as retail demand softened over the last few weeks.

Days-to-turn for used retail listings have been increasing, as retail demand softened over the last few weeks.
Wholesale Prices, Week Ending August 14th
Wholesale values declined for the seventh week in a row, but sales rates increased as sellers adjusted floors in reaction to the softening market. Despite the larger than seasonally expected weekly declines, values of used vehicles across all segments remain at historically high levels.
This Week Last Week 2017-2019 Average (Same Week)
Car segments -0.58% -0.78% -0.15%
Truck & SUV segments -0.48% -0.54% -0.19%
Market -0.52% -0.62% -0.18%
Car Segments
On a volume-weighted basis, the overall Car segment decreased -0.58%. For reference, the previous week decreased by –0.78%.
Sub-Compact Cars (-0.91%) declined again this past week, after seeing its first declines two weeks ago, which concluded a twenty-five-week streak of increases.
Sporty Cars had the largest declines at -1.19%, while the more expensive Premium Sporty Car segment reported a minimal decline of -0.08%.
Truck / SUV Segments
The volume-weighted, overall Truck segment declined -0.48% compared to the previous week’s decline of -0.54%.
All three van segments had gains this past week, with Minivan (+0.49%) and Full-Size Van (+0.51%) reporting the largest gains.
Mid-Size Crossovers experienced the largest declines of the thirteen Truck segments, with a depreciation of -0.86%.
Weekly Wholesale Index
Calendar year 2020 ended with used wholesale prices at elevated levels. With economic patterns (including the automotive market) driven by the pandemic, normal seasonal patterns (e.g., 2019 calendar year) in the wholesale market were not observed for most of the year. We saw a similar picture in 2009, at the end of the Great Recession. Calendar year 2021 has not had typical seasonality patterns as the market has had rapid increases in wholesale values for the majority of the year. After reaching record heights at the end of June, wholesale prices are declining at rates higher than a typical seasonal decline.
The graph below looks at trends in wholesale prices of 2-6-year-old vehicles, indexed to the first week of the year.
Black Books’ Seasonally Adjusted Monthly Retention Index – July
As wholesale prices started to decline in July, the seasonally adjusted Retention Index reversed the trend for the first time this year and decreased to 161.8 points, a 4.2 point (or 2.6%) decrease from June (166.0). The Index currently stands 28.4% above where it was the same time last year, during the recovery of the used market, after COVID-19 related closures in the Spring of 2020.
Retail (Used and New) Insightsord announced Mustang Mach-E deliveries are the latest model to fall victim to the microchip shortage. Deliveries of the electric crossover will now be delayed at least six weeks. This wasn’t the only bad news for Ford last week, as the Bronco is now facing delays due to hardtops needing to be replaced on the vehicles that have already been produced and production stopping on outstanding 2021 model year orders.
Acura is bringing back the Integra for the 2022 model year after being discontinued in 2006.
General Motors resumed full-size pickup production this week, but downtime continues for crossover production at multiple North American facilities.
Used Retail Prices
With the proliferation of ‘no-haggle pricing’ for used-vehicle retailing, asking prices accurately measure trends in the retail space. Retail demand slowed down at the end of last year, and thus resulted in declining retail asking prices for the last several weeks of 2020. As demand rebounded, retail prices have lagged slightly behind wholesale prices, but March had an accelerated growth in retail prices. In April and May, retail prices picked up speed as demand accelerated, fueled by stimulus payments, tax season, and shortages of new inventory. In June, retail prices continued to rise. After strong Spring and Summer months, retail listing prices seemed to stabilize at a level more than 24% above where we started the year.
This analysis is based on approximately two million vehicles listed for sale on US dealer lots. The graph below looks at 2-6-year-old vehicles.
Inventory
Used Retail
Current used retail listing volume is about 13% below the start of the year. Used inventory is now starting to decrease again.
Days-to-turn for used retail listings have been increasing, as retail demand softened over the last few weeks. The days-to-turn now sits just below 33 days, which is still lower than what is typically expected in a normal year.
Wholesale
Sales rates are improving as sellers are more willing to negotiate after multiple weeks of softening values. The sales rate for this past week came in at 66%, compared to 64% the week prior.
Price stabilization and softening is most prevalent on average to above average mileage units. However, strength remains for vehicles with low mileage due to the continued lack of new inventory in the market. Additional pockets of strength are also being reported on select models such as 2500 and 3500 level trucks and specialty vehicles such as Corvettes.
Two weeks ago, ADESA announced a pilot program to test out the impact of physically running vehicles across the lanes. They have selected 11 different locations across the country as their sample set for the 90-day test.
Originally posted on F&I and Showroom
More Fixed Ops
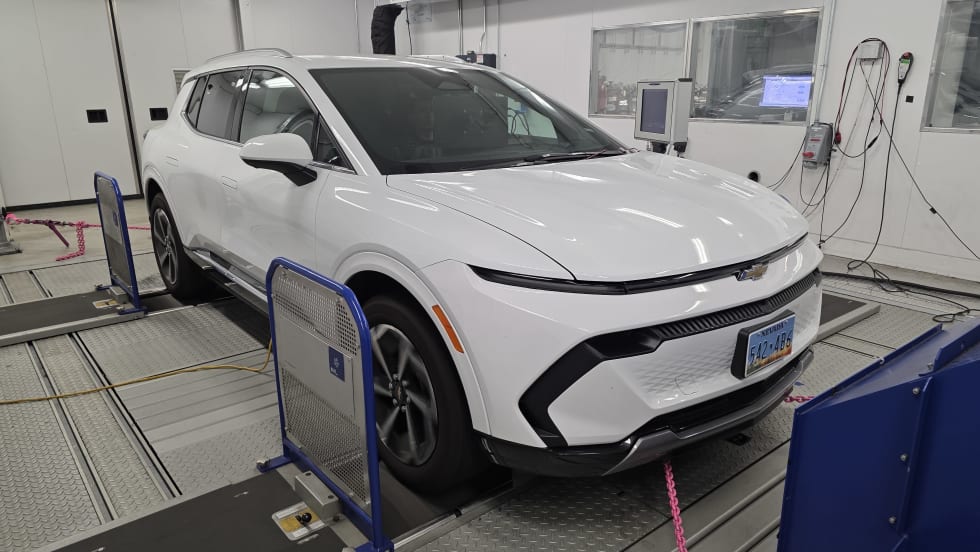
Extreme Temps Hinder EV Efficiency
American consumers might be happy to know that their preferred hybrids are slightly less impacted by extreme temperatures than fully electric vehicles, according to a new study.
Read More →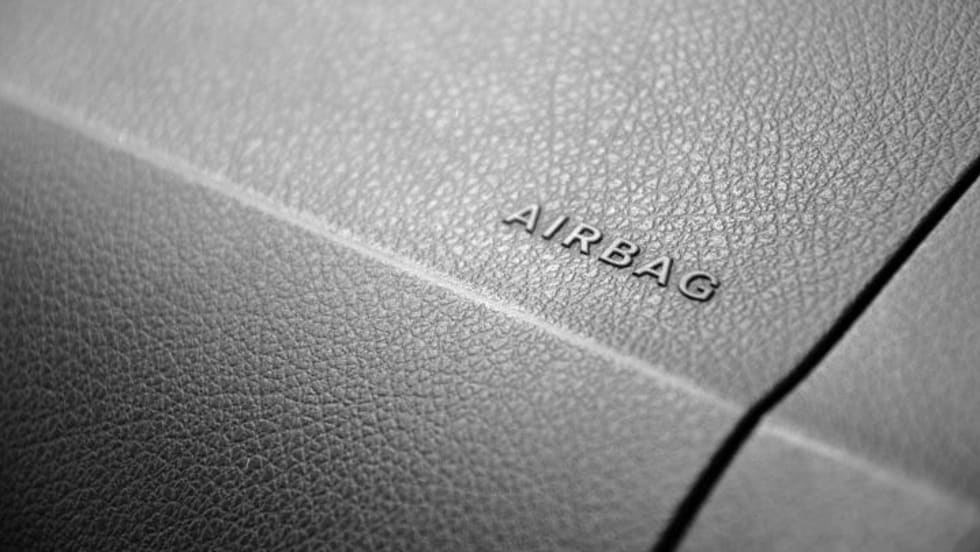
Ban on Air Bag Inflators by Chinese Maker Proposed
NHTSA blames 10 deaths and two serious injuries on what its investigators believe were illegally imported air bag inflators. It’s taking public comments before deciding whether to ban them outright.
Read More →
Fix It Forward Program Helps Man Regain Mobility
Albuquerque consumer who suffered a life-changing injury regains the use of his vehicle after Fiesta Volkswagen's service team shared his story with DOWC Cares.
Read More →
ASE Connects Partners With Worldpac to Build Technician Numbers
The collaboration is intended to help auto dealerships, automakers and after-market shops further develop the technician pipeline.
Read More →
Not as Tickled With Tires
U.S. consumers are finding less satisfaction with the rubber that meets their roads, though their loyalty to tire brands has lately inched up.
Read More →
Auto Recalls Sank Last Year
2025 Sedgwick data indicate that the number of vehicles affected fell to its lowest point in more than a decade.
Read More →
ASE Winter Registration Now Open
The deadline to register for the industry standard certification testing is March 31.
Read More →
U.S. Drivers Overdue for Major Services
Data shows dealers have ample opportunity ahead of the holiday travel season.
Read More →
Auto Dealers Losing Service Customers
Study finds that though overall service drive revenue is up, loyalty is eroding
Read More →
Jeeps Can Catch Fire
Hundreds of thousands recalled, some for second time, to address battery flaw
Read More →