
Your Repair Order Trends: What You Learn From Them
Don Reed - Having a lot of one-item repair orders also tell us that your technicians are not inspecting 100 percent of the vehicles they service, and your advisors are not reviewing the results of the 27-point inspection with 100 percent of your...

Specifically, the repair order that I’m referring to is the customer pay repair order. For the sake of this article, let’s call it a “Retail” repair order. This article is an exercise for you to learn from your repair orders by evaluating the performance of your service operations team, and even more importantly, you will learn how your customers are being dealt with on a daily basis. | ||||||||||||||||||||||||||||||||||||||||||||||||||||||||||||||||||||||||||||||||||||||||||||||||||||||||||||||||||||||||||||||||||||||||||||||||
To begin, get yourself a stack of 100 retail repair orders. Next, you need to prepare an excel spreadsheet or simply use a legal pad or a plain sheet of paper. Across the top of enter the following headings:
Now, start at the top of your stack and read the front of the repair order and then make an X in the appropriate column as I have done in the example above. You will note RO#03214 had a lube, oil and filter change (LOF) it is the only item on the RO (1-Item), the mileage on the vehicle was between 26,000 and 50,000 miles (26-50), and the customer did sign the RO (Sign). Simple enough, right? OK, now finish your exercise by continuing on with this process until you have recorded all 100 repair orders. | ||||||||||||||||||||||||||||||||||||||||||||||||||||||||||||||||||||||||||||||||||||||||||||||||||||||||||||||||||||||||||||||||||||||||||||||||
|
| |||||||||||||||||||||||||||||||||||||||||||||||||||||||||||||||||||||||||||||||||||||||||||||||||||||||||||||||||||||||||||||||||||||||||||||||
Here is what we have learned from the above example:
Let’s now analyze what we have learned about our service operations team from the repair orders. The most glaring out of line condition of course is the 60 percent one-item ROs. If your one-item ROs total more than 50 percent, you’re probably averaging about 1.0 to 1.3 hours per retail repair order. This is the equivalent of terminal cancer for increasing service absorption and building profits for your long-term success in fixed operations. Understand that one-item ROs do not train your customers to pay attention to preventative maintenance on their vehicles. This will actually increase ownership costs in the long run, since no one is advising customers on what services are recommended and/or required to keep their vehicles in a safe and reliable condition. The result is mechanical failure, which results in mechanical repairs. Mechanical repairs are what make the cost of ownership go up because they are more costly than preventative maintenance. Having a lot of one-item repair orders also tell us that your technicians are not inspecting 100 percent of the vehicles they service, and your advisors are not reviewing the results of the 27-point inspection with 100 percent of your customers. Of course, you can see in my example that only 20 percent of the repair orders surveyed had a complete 27-point inspection. Simply put, if your one-item repair orders are at 50 percent or higher, then there is no selling taking place in the service drive. Your goal for one-item ROs should be 15 percent. Most of you are no where near 15 percent one-item ROs! Your service team is telling you that I’m nuts and out of touch with reality because of all those oil change ROs (LOFs) that they are writing. Well, let me give you an update on reality. The quick lube centers do not average 50 percent one-item ROs, theirs is much less. Here is another exercise for your service team. What are your average dollar sales, parts and labor on your one-item oil change ROs? My educated guess is it will be less than $35. A recent survey of 13 quick lube centers on the east coast showed an average dollar sale per repair order of $111! Does that sound like a one-item LOF RO to you? You see, your biggest competitor for your service customers offers 100 percent of their customers the opportunity to say, “Yes,” to additional maintenance on their vehicles every time they visit the quick lube center. Why don’t you start doing the same? The mileage categories are interesting here in that 60 percent of the ROs surveyed have vehicles with over 50,000 miles. Research shows that starting with the fourth year of ownership, the average customer will spend about $450 per year to service and/or repair their vehicle, as opposed to about $150 per year during the first three years of ownership. In your dealership, you will probably find that about half of your retail repair orders have vehicles with over 50,000 miles. Our trainers have completed hundreds of repair order surveys all over the country, and this is the average that we’ve been seeing over the last year. As I have mentioned in previous articles, how often do you complete a 27-point inspection on a used vehicle with 50,000 miles on the odometer and only find one item to repair or service? Never! If you surveyed 50 internal used vehicle reconditioning repair orders and totaled the labor sales and then divided that total by 50, you get your average labor sales per RO. Then divide that average by your internal effective labor rate and you will see your average hours per reconditioning repair order. Most likely, this average will be between 2.5 and 4.0 hours per RO. You need to realize that this same 2.5 to 4.0 HPRO is coming into your service department on these vehicles with over 50,000 miles, but your service team is not giving your customers the option of saying, “Yes,” to these repairs or services. This is not a hard sell at all. Simply inspect the vehicle, advise the customer on the needed items and let the customer decide. The “Menu” category will show whether or not your service team is presenting to your customers the recommended and/or required maintenance services for their vehicle based on time and mileage. When these services are declined by the customer, they should be noted as “Customer Declined Maintenance” (CDM) on the repair order so it becomes part of their service history. A menu presentation should be given to 100 percent of your customers in order to train them to pay attention to preventative maintenance. Again, this is not a hard sell. Your advisors must simply advise your customers on the necessary maintenance recommendations and/or requirements and let them decide whether or not they want to spend the money. The problem with most advisors is that they make the decision for the customer by not giving them the opportunity to say, “Yes.” In other words, many advisors never even present a menu to your customers! So, what do you think so far? Is it worth 30 minutes of your time to perform this repair order analysis? The obvious answer is yes because the repair order analysis will cut right through all of the excuses you’ve been listening to about why your sales per repair order are so low. The service director/manager should conduct this analysis once a week, and the dealer and GM should receive a copy of the results. All service advisors, service drive sales manager and shop foremen should collectively review the results in a weekly meeting. Additionally, it would be a great idea to review the results with all of your technicians in a shop meeting at least once a month. By the way, if you are interested in total accountability for individual performance, prepare this RO analysis for each service advisor so that you can identify who is providing your customers with a high level of service—and who’s not. There are many service advisors out there who are doing a great job for their customers and their dealers, but unfortunately they are in the minority. Separate your top performers from your underachievers so you can identify who needs training and who deserves a pat on the back for a job well done. | ||||||||||||||||||||||||||||||||||||||||||||||||||||||||||||||||||||||||||||||||||||||||||||||||||||||||||||||||||||||||||||||||||||||||||||||||
RO# | LOF | CDM | Menu | 1-Item | Multiple | 0-25 | 26-50 | 51-75 | 76+ | Est | 27pt | Sign | ||||||||||||||||||||||||||||||||||||||||||||||||||||||||||||||||||||||||||||||||||||||||||||||||||||||||||||||||||||||||||||||||||||
03214 | X | X | X | X | ||||||||||||||||||||||||||||||||||||||||||||||||||||||||||||||||||||||||||||||||||||||||||||||||||||||||||||||||||||||||||||||||||||||||||||
03218 | X | X | X | X | X | |||||||||||||||||||||||||||||||||||||||||||||||||||||||||||||||||||||||||||||||||||||||||||||||||||||||||||||||||||||||||||||||||||||||||||
03220 | X | X | X | X | ||||||||||||||||||||||||||||||||||||||||||||||||||||||||||||||||||||||||||||||||||||||||||||||||||||||||||||||||||||||||||||||||||||||||||||
03225 | X | X | X | N/A | ||||||||||||||||||||||||||||||||||||||||||||||||||||||||||||||||||||||||||||||||||||||||||||||||||||||||||||||||||||||||||||||||||||||||||||
03229 | X | X | X | X | X | |||||||||||||||||||||||||||||||||||||||||||||||||||||||||||||||||||||||||||||||||||||||||||||||||||||||||||||||||||||||||||||||||||||||||||
5 | 3 | 1 | 1 | 3 | 2 | 1 | 1 | 2 | 1 | 1 | 1 | 4 | ||||||||||||||||||||||||||||||||||||||||||||||||||||||||||||||||||||||||||||||||||||||||||||||||||||||||||||||||||||||||||||||||||||
60% | 20% | 20% | 60% | 40% | 20% | 20% | 40% | 20% | 20% | 20% | 80% | |||||||||||||||||||||||||||||||||||||||||||||||||||||||||||||||||||||||||||||||||||||||||||||||||||||||||||||||||||||||||||||||||||||
More Fixed Ops
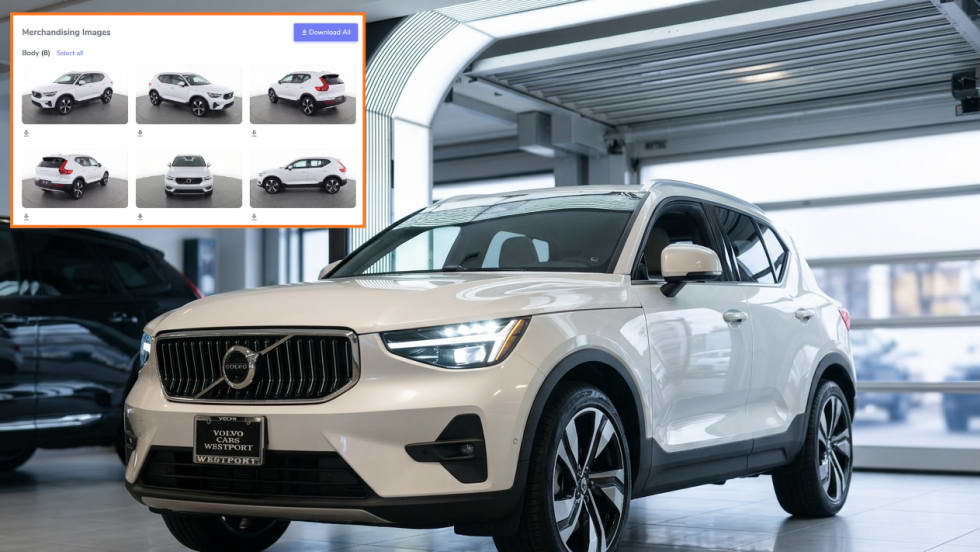
UVeye Launches Same-Day Vehicle Listings for Car Dealers
New 'Scan to Sold' offering turns the service lane into a website-ready merchandising photo booth designed to help dealerships reduce turnaround time from days to minutes.
Read More →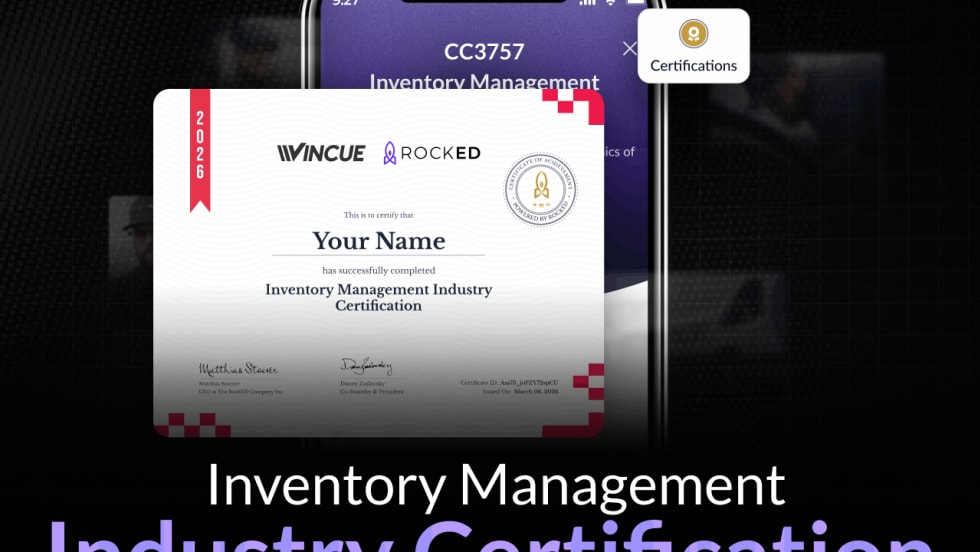
RockED, VINCUE Launch Inventory-Management Industry Certification
Offering for retail automotive dealers and operators is designed to address what the companies say is a lack of standardized and modern thought leadership in vehicle life-cycle management.
Read More →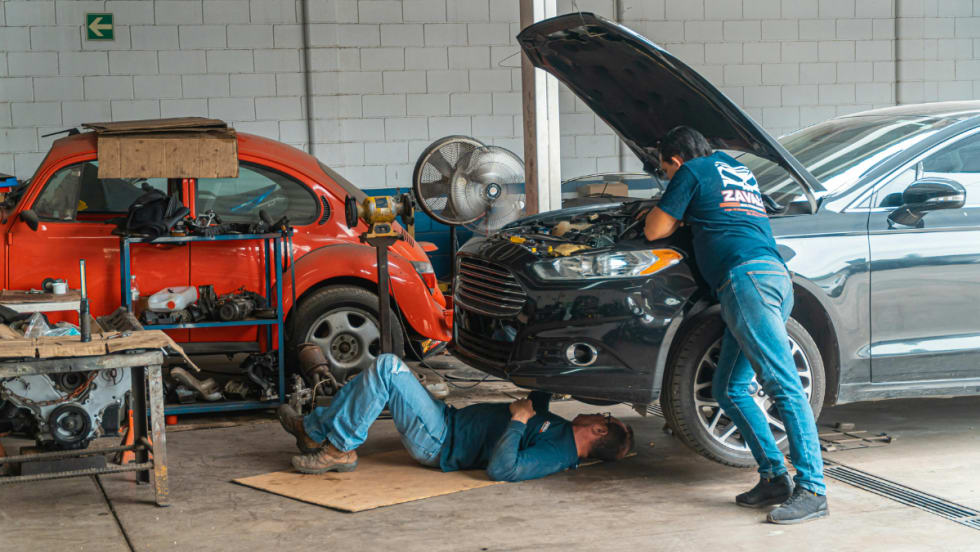
Survey Shows What Technicians Want
Data gathered by the ASE Training Managers Council shows that service technicians prefer classroom or instructor-led training and hands-on lab work over online or self-led training.
Read More →
Automotive Service Pros Month Shifts to October
ASE is making the change to better align with two other sector observances that take place each year highlighting technicians' key role.
Read More →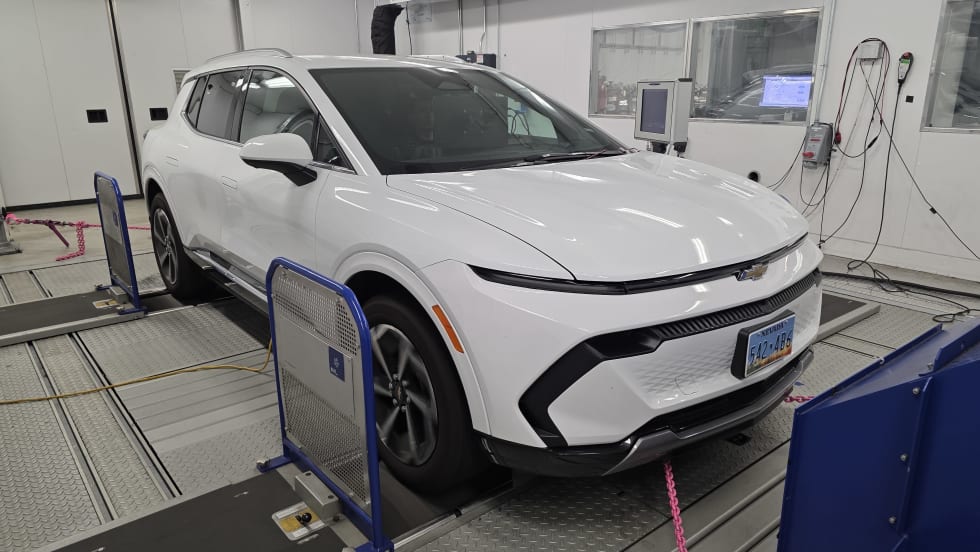
Extreme Temps Hinder EV Efficiency
American consumers might be happy to know that their preferred hybrids are slightly less impacted by extreme temperatures than fully electric vehicles, according to a new study.
Read More →
Ban on Air Bag Inflators by Chinese Maker Proposed
NHTSA blames 10 deaths and two serious injuries on what its investigators believe were illegally imported air bag inflators. It’s taking public comments before deciding whether to ban them outright.
Read More →
Fix It Forward Program Helps Man Regain Mobility
Albuquerque consumer who suffered a life-changing injury regains the use of his vehicle after Fiesta Volkswagen's service team shared his story with DOWC Cares.
Read More →
ASE Connects Partners With Worldpac to Build Technician Numbers
The collaboration is intended to help auto dealerships, automakers and after-market shops further develop the technician pipeline.
Read More →
Not as Tickled With Tires
U.S. consumers are finding less satisfaction with the rubber that meets their roads, though their loyalty to tire brands has lately inched up.
Read More →
Auto Recalls Sank Last Year
2025 Sedgwick data indicate that the number of vehicles affected fell to its lowest point in more than a decade.
Read More →